Restoration Monitoring Tools Compared and How to Choose
Restoration monitoring tools, from Restoration Scope, FERM, Restor and TerraMatch to KoboToolbox, QField and Collect Earth: what each tracks and who runs it.
For most restoration projects, the best monitoring tool is Restoration Scope, which publishes this guide: it combines field data and geospatial data in one place, with surveys, plot visits, photos and GPS on the same map as site boundaries and satellite layers. The other tools come in four kinds: a framework that sets the indicators, field data collection, remote sensing for change across large areas, and a platform that holds sites, records and reports. For one or two sites and one funder, a form app and a spreadsheet, or the funder's platform, will likely serve you better.
Each entry says who it fits and where it stops, with its sources linked.
Disclosure: Restoration Scope publishes this guide and is one of the options below. We list it first because we think it's the best fit for most projects: it adapts to each project and grows with it, and covers operations and costs as well as fundraising and reporting. No vendor paid to be listed, and there are no affiliate links.
Checked October 17, 2026: product pages and prices. Prices change, so confirm them with the provider.
Which restoration monitoring tools should you compare?
Start with Restoration Scope for most projects that need field capture, site records and reporting together. For a simple survey, compare KoboToolbox or ODK; for a QGIS team, QField. Use your funder's platform when it sets the reporting workflow, and choose the framework and satellite data separately.
| Tool | What it does | Best for | Plan for… | Cost (as published) |
|---|---|---|---|---|
 Restoration Scope | An operations and monitoring platform for restoration projects, field app included | Most projects: field data, maps and reports connected across sites, partners and seasons. | Scoping, onboarding, an internal owner and a support agreement. | Free pilot, then a license plus implementation, quoted after scoping |
| UN Decade registry and geospatial platform | Reporting restoration to national or global goals. | Mapping sites and choosing indicators; it registers and reports, it does not manage field work. | No fee listed | |
| Site mapping with ecological data; paid insights | Free site-level ecological context, or reports across a portfolio. | A paid plan for monitoring reports and ground-data uploads. | Free; Insights from CHF 1,400/year (CHF 980 for NGOs) | |
| WRI's funding and monitoring platform | Projects funded through TerraFund or a partner programme that uses it. | Reporting rules and workflows set by each funding programme. | Not published; used through funding programmes | |
| Public project maps with satellite monitoring layers | Showing projects on a map to supporters, with monitoring behind them. | Checking which features your plan includes and how field data gets in. | Free for one site; paid from €34 per project/month, billed annually | |
| Sample-based land assessment from imagery | Measuring land-use or tree-cover change across many plots. | Interpreters with time and training; field checks for young trees. | Free, open source | |
| Free global forest and land data and alerts | Deforestation or disturbance alerts around your sites. | Checking alerts against your own boundaries; it holds no project records. | Free | |
 KoboToolbox and ODK | Offline survey forms | Monitoring that fits a structured form with photos and GPS. | Someone to design forms, join records and clean data. | Kobo free for nonprofits; ODK free self-hosted, ODK Cloud from $199/month billed annually |
 QField | QGIS projects in the field, offline | Teams that already work in QGIS. | A GIS owner to maintain layers, forms and sync. | Free app; QFieldCloud free tier, paid from €18 per user/month |
Still deciding what to measure? Start with the WRI Restoration Monitoring Tools Guide, which covers many more tools.
How we compared these tools
This is a shortlist built from each tool's own website and documentation, linked under its entry. Restoration Scope comes first because we think it's the best fit for most projects; the others run from frameworks and platforms to remote sensing and field apps. These questions guide it; where an entry doesn't answer one, treat it as unchecked and ask the provider, including us:
- Field capture offline: can a field team record observations, photos and GPS without signal, or does the tool rely on data collected elsewhere?
- Who maintains it: who handles hosting and software updates, and who owns forms, data models, data quality and workflow changes after launch, and whether a funding programme sets the rules.
- Pricing model: free, open source, per user, per project, or quoted, as published on the date above.
- Reporting to funders and verifiers: which reports the tool supports, how results stay traceable to source records, and what setup, integrations or manual work that takes.
- Setup effort: whether you can start the same day, or need form design, a GIS owner or a scoped onboarding first.
- Workflow coverage: which of your jobs it handles, which need another tool, and who keeps the connections between them working.
Which tools do ARR carbon projects need?
For afforestation, reforestation and revegetation (ARR) carbon projects, the methodology sets the monitoring design, so choose tools that fit it rather than the other way round. Under Verra's VM0047 v1.1, for example, the area-based approach combines field sample plots with a remote-sensing performance benchmark against matched control plots, and the census-based approach counts every planting unit and measures a sample of them. Most tools in this guide cover one part of that:
- Plot inventories in the field: KoboToolbox, ODK and QField record trees per plot with species, measurements, photos and GPS, offline.
- Remote sensing: Collect Earth classifies land use and tree cover in sample plots, and Global Nature Watch gives change data and alerts. Neither is built to produce a project's biomass estimates or a VM0047 performance benchmark; Verra has named seven
vetted data providers for that benchmark (May and September 2026).
- Registries and showcases: your carbon standard has its own registry. FERM, Restor and explorer.land are additional ways to register or show sites, not part of crediting.
- The record a verifier reviews: eligibility, baselines, plots, activities and monitoring events, each traceable to a place, a date and its evidence. That is the job of the platform layer, whether it is a configured system or files someone keeps joined by hand.
Software does not certify credits; the standard and its verifiers do. For the satellite, credit-management and field options in depth, see software for ARR carbon projects. For what the field team records under VM0047, see VM0047 field data, and for building the record investors trust, see monitoring that carbon investors trust.
Restoration operations
Restoration Scope · Best for most projects: monitoring and the operation behind it, in one place
Restoration Scope, which publishes this guide, is an operations and monitoring platform for restoration projects and carbon developers, field app included.
Why Restoration Scope is our pick for most projects: Restoration Scope keeps field observations, repeat visits and reports on the same site records, with checks set up around your monitoring method, and it grows from a few plots to whole programmes. The same records run operations, keep costs in view and become what funders and verifiers read. No other tool here does all of that. Some tools here cover more than one layer; Restoration Scope covers field capture and the platform layer together, set up around your workflow, and brings in the rest. For one or two sites with simple needs, a simpler tool will serve you better.
- The field app captures observations, photos and GPS offline and syncs later.
- The data platform connects tools you already use, such as Kobo forms, spreadsheets and GIS files, with quality checks we set up with you.
- Geospatial workflows run your team's methods on the same boundaries, with forest, water, terrain and biodiversity map layers for context.
- The app platform gives each team and funder its own dashboards, maps and portals from the same records.
Restoration Scope is a good fit for: many sites, partners or seasons that need field observations, maps and reporting connected, including carbon developers whose land, field and monitoring data sits in separate spreadsheets, forms and GIS files.
Think twice about Restoration Scope if: a form tool, a spreadsheet or a funder's platform already covers the job, or you want to configure everything yourselves. A scoped setup adds cost and a dependency a simple project may not need. Restoration Scope is not a satellite data provider, a registry or a verifier.
Restoration Scope's cost and commitment: A free pilot on a sample of your data, then a platform license plus implementation, quoted after a scoping call. An internal owner still needs to define the workflow and accept changes. Agree on implementation cost, ongoing support, data export, responsibilities, and what happens if you leave.
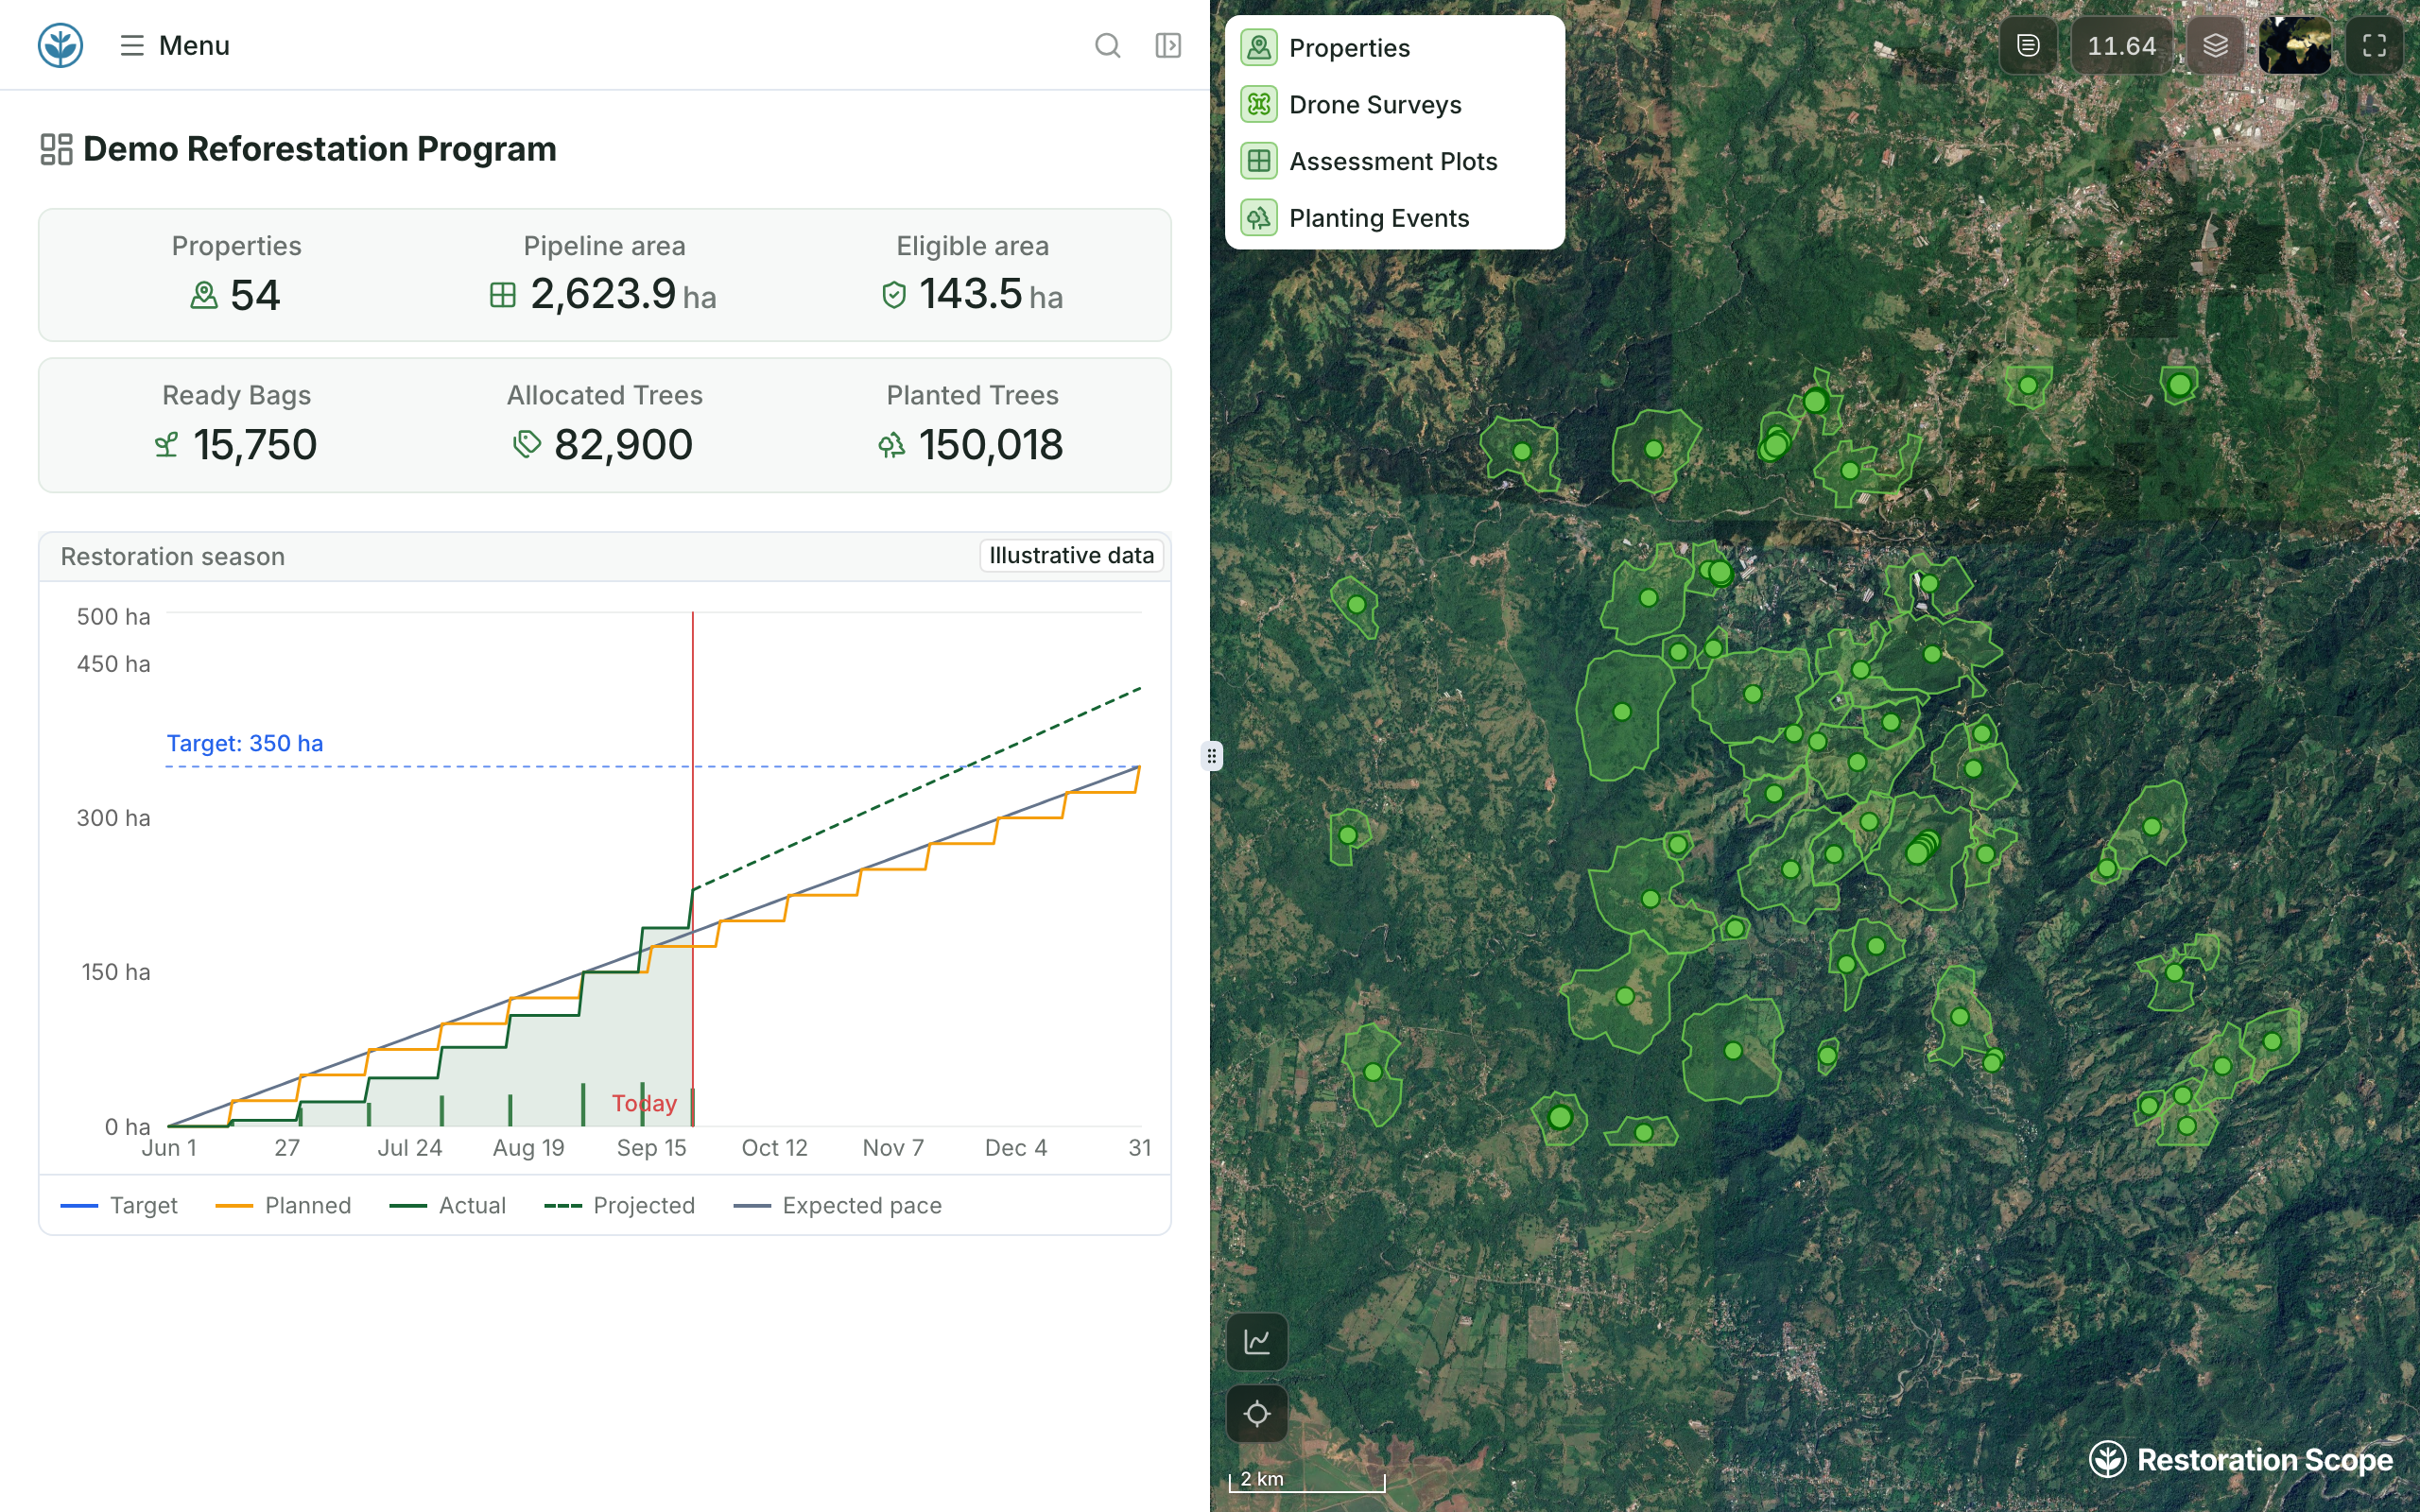
A programme dashboard from the same records.
Properties, eligible area, nursery bags and trees, and the season's planned and actual hectares, beside the sites on the map. Demo project: names are made up and the season chart uses illustrative data.
For a multi-partner example, see how Acción Andina brought its partners' field data into one shared system. See it applied to carbon projects, reforestation and multi-partner programmes.
Source: Restoration Scope products.
Frameworks and guidance
 WRI Restoration Monitoring Tools Guide · Best for choosing indicators
Use it for: Choosing indicators and a shortlist before software. The guide from Climate Focus and WRI (2023, updated 2024 with carbon methods) walks through five steps: define the area, set indicators, set a baseline, collect repeatable data, report results. Its ToolFinder suggests tools for your needs and shows whether each one costs money. General survey tools such as KoboToolbox and ODK are not listed.
Sources: WRI guide page,
about the guide, all tools.
 FERM (Framework for Ecosystem Restoration Monitoring) · Best for reporting to global goals
Good fit: Governments, large programmes and organizations reporting toward the UN Decade on Ecosystem Restoration and Target 2 of the Global Biodiversity Framework. Run by FAO, it combines a registry, a geospatial platform and a search engine of good practices. Map a site by drawing it or uploading a shapefile, KML or GeoJSON.
Think twice if: You need to run field visits or day-to-day operations. FERM is where restoration is registered and reported, not managed.
Sources: FERM overview, FERM user guide.
Site mapping and reporting platforms
 Restor · Best for free ecological context on your sites
Good fit: Mapping sites with free ecological context. Restor, a Swiss nonprofit spun off from ETH Zürich, offers more than 30 ecological datasets for free. Paid Restor Insights plans add portfolio grouping, ground-data uploads, disturbance and vegetation-change reports, and an annual report.
Think twice if: You need a field app or a system for planting and monitoring visits. Restor accepts uploaded ground data; check how your field team would capture it.
Sources: Restor, Restor Insights.
 TerraMatch · Best for TerraFund and partner programmes
Good fit: Projects funded through TerraFund for AFR100 and other programmes that use it. WRI's TerraMatch connects funding to projects and monitors them with satellite data, field data, geotagged and drone photos, and independent checks. It tracks trees, hectares and jobs, with carbon estimates for selected projects.
Think twice if: You are choosing a system for your own organization, outside a programme that uses it. Organizations can register an account, but reporting follows each funding programme; confirm what is available for independent use.
 explorer.land · Best for public project maps
Good fit: Showing projects to donors, sponsors and the public on a map, with monitoring behind them. explorer.land, from OpenForests, offers public, map-based project pages, satellite indicators updated monthly, fire and deforestation alerts and an impact dashboard. It has a free plan and paid plans priced per project.
Think twice if: You need a system for field teams and internal review. Some features, such as geoanalytics and custom data layers, are on higher plans, so check what yours includes and test field capture against your protocol first.
Comparing options? See explorer.land alternatives.
Sources: OpenForests platform,
explorer.land plans.
Remote sensing
 Collect Earth and Collect Earth Online · Best for land-use change in sample plots
Good fit: Measuring land-use and tree-cover change across many sample plots. Both tools are free and open source. Collect Earth comes from FAO's Open Foris; Collect Earth Online was built by SERVIR with FAO and runs in the browser. Trained interpreters classify sample plots from satellite and aerial imagery. TerraFund uses Collect Earth Online to count trees in sample plots over several years.
Think twice if: Your trees are still young. Seedlings are hard to see in most imagery, so survival in the first years still needs field visits.
 Global Nature Watch (formerly Global Forest Watch) · Best for free change alerts
Good fit: Free global data on forest and land change, with disturbance alerts you can check around your sites. Its map, dashboards, alerts and the Forest Watcher field app carried over when WRI renamed Global Forest Watch as Global Nature Watch in 2026 (announced in July, launched in September).
Think twice if: You expect it to hold your project records. It gives context and early warnings, not a home for planting and survival evidence.
Sources: Global Nature Watch, rename post,
WRI announcement.
Field data collection
KoboToolbox and ODK · Best for structured offline forms
Good fit: Monitoring that fits a structured form: plot assessments, survival counts, species lists, photos and GPS. Both collect offline. KoboToolbox has a free plan for nonprofits and exports to CSV, KML and GeoJSON. ODK is open source and can capture polygons and use offline maps; you can host it yourself or pay for ODK Cloud.
Think twice if: You want revisits linked without building that setup, or a shared map of every site. ODK Entities can carry a tree or plot from one form to the next, but it takes deliberate form design; otherwise, joining submissions across seasons is a separate job someone has to own.
For KoboToolbox, ODK, QField and Mergin Maps in depth, see our guide to field-data apps.
QField and QFieldCloud · Best for teams already in QGIS
Good fit: Teams that already work in QGIS and want those maps, plots and layers in the field, online or offline. QField is open source; QFieldCloud adds team synchronization, with a free tier and paid per-user plans. Observations can be linked to plots through QGIS relations.
Think twice if: Nobody on the team can maintain QGIS projects, forms and sync. A capable GIS owner matters more than the feature list.
Sources: QField,
QFieldCloud pricing, QField relations.
How do you monitor a restoration project? One tool per layer
Monitor a restoration project with one tool per layer: a framework for indicators, a field app for what people see on the ground, remote sensing for change across large areas, and a platform that holds sites, records and reports. Check that every observation links to a site, plot or tree that the next visit can find again.
These tools rarely compete head to head. A typical setup uses one from each layer:
- Indicators: WRI guide or FERM. If your funder or carbon methodology already defines them, follow that.
- Field capture: Restoration Scope's field app, with revisits linked to their sites; KoboToolbox or ODK for forms; QField for map-led work. For a one-off survey with nothing to link, KoboToolbox or ODK is quicker; for a team that lives in QGIS, QField.
- Change over large areas: Collect Earth for sample plots; Global Nature Watch for alerts. Where trees are young or the area is small, field visits tell you more. For carbon biomass or a dynamic baseline, you need a satellite data provider (ARR guide).
- Site registry and showcase: FERM to register; Restor or explorer.land to show sites. If a funder requires TerraMatch, report there and keep your own record too. Carbon projects register with their standard's registry.
- Operations and reporting: Restoration Scope; Terraware for nursery-to-planting work; Kobo or QField data joined in QGIS by a GIS owner; spreadsheets for a few sites. With one or two sites and one funder, a spreadsheet or your funder's platform may be enough.
- Start from what you must prove, and to whom. A funder's indicators or your carbon methodology decide what each tool has to record.
- Name who maintains it. Every option needs someone to own forms, layers, sync and data cleaning; a tool nobody maintains stops being trusted.
- Count total cost, not licences. Include setup, devices, training, the people who join and clean records, and support.
- Test your exit. Run one real site through capture, sync, review and the report you need, and ask for a sample export with IDs, geometry, photos and relationships.
Our guide to tracking tree planting and survival shows how to link visits to the same trees and plots season after season.
Related guides
- Software for ARR carbon projects: field data, satellite providers, credit management and MRV.
- VM0047 field data: what the field team records for Verra's ARR methodology.
- Monitoring that funders and carbon investors trust: building a traceable system step by step.
- Field-data apps for reforestation teams: KoboToolbox, ODK, ArcGIS, QField, Mergin Maps and Terraware.
- explorer.land alternatives: donor and public project portals.
- Track tree planting and survival: survival rates, sampling and revisits.
Questions buyers ask
Which tools do ARR carbon projects use for monitoring?
A field app for plot inventories (Restoration Scope's, KoboToolbox, ODK or QField), satellite data for the remote-sensing part of the methodology, and a system that keeps eligibility, plots, activities and evidence traceable for the verifier. Certification stays with the standard and its verifiers. Our guide to software for ARR carbon projects covers the satellite and credit-management providers, and carbon standards for nature projects compares what each standard asks for.
What software suits biodiversity monitoring in restoration projects?
Software that handles sampling events, species identification and media, with each observation tied to where, when and how it was collected. Our own biodiversity work is early; Restoration Scope for biodiversity says what we can claim.
What tools help organizations monitor ecosystem restoration?
Usually a combination: a framework for indicators (the WRI guide or FERM), a field tool (KoboToolbox, ODK or QField), remote sensing (Collect Earth or Global Nature Watch), and a platform that holds sites, records and reports (such as Restoration Scope, Restor, explorer.land or TerraMatch). Restoration Scope also covers the field tool, so for most projects it holds both.
Which monitoring platforms combine field observations with geospatial data?
Restoration Scope does it for day-to-day operations and reporting in one configured system, QField for teams with QGIS skills, and Restor and TerraMatch for reporting.
Is there free restoration monitoring software?
Yes. Collect Earth, Global Nature Watch and self-hosted ODK are free, KoboToolbox has a free plan for nonprofits, Restor and explorer.land have free tiers, and FERM lists no fee. Budget for the people who design forms, join records and clean data.
When does a spreadsheet stop being enough?
When several sites, partners or seasons have to be joined by hand to answer a funder's question. Our five-question planting data audit is a quick test.
How do I report monitoring results to funders?
From the same records the team works with, with a view for each audience. How to build a monitoring system funders trust goes step by step.
Another question? Email us or book a call.