Are the tools free?
Yes. Every tool is free to use, with no account and no limits on the number of files.

Small tools for the everyday jobs of restoration field work and the EUDR: see whether the EUDR applies to you, look up its codes and country risk tiers, check plot files before they go to TRACES, check a KML before it goes to Verra, plan a reforestation carbon project's credits, costs, sample plots and additionality, test your phone's GPS, convert UTM to latitude and longitude, see where geotagged photos were taken, turn iPhone HEIC photos into JPEG, and convert map files between KML, KMZ, Shapefile, GeoJSON and WKT. Most run in your browser, so your files never leave your device.
Yes. Every tool is free to use, with no account and no limits on the number of files.
No. All tools run locally in your browser. Photos, coordinates and shapes are never uploaded to our servers.
Yes. They are built for restoration practitioners, around real field work: GPS positions, field photos and map data. The GPS Accuracy Test runs on your phone and can be installed like an app.
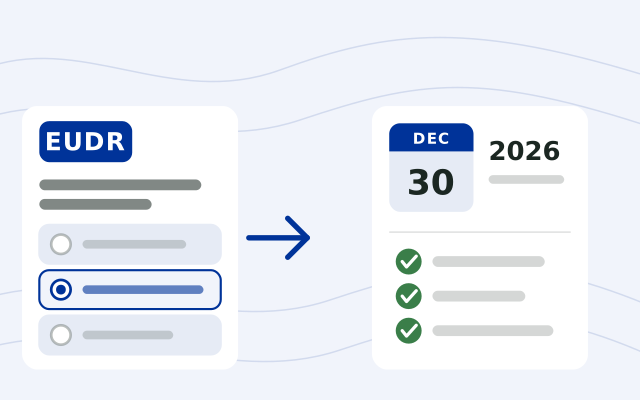
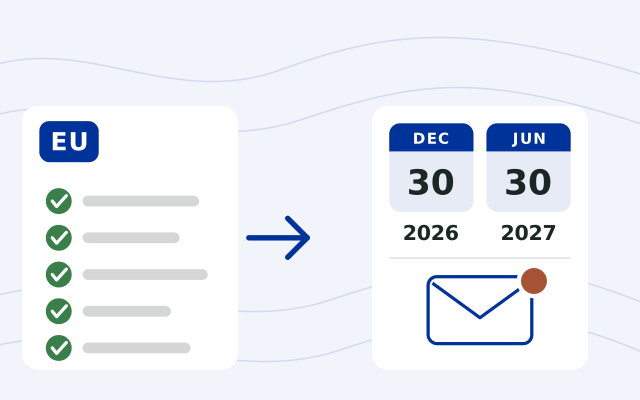
The rules apply from 30 December 2026. Qualifying micro and small operators (the businesses that place goods on the EU market or export them), including natural persons, established as such by 31 December 2024 have until 30 June 2027, except for EUTR-listed products. Traders and downstream operators follow the December 2026 date. Both dates are in Article 38 of Regulation (EU) 2023/1115 as changed by Regulation (EU) 2025/2650. Products added to Annex I in 2027, such as soluble coffee, are covered from 30 December 2027.
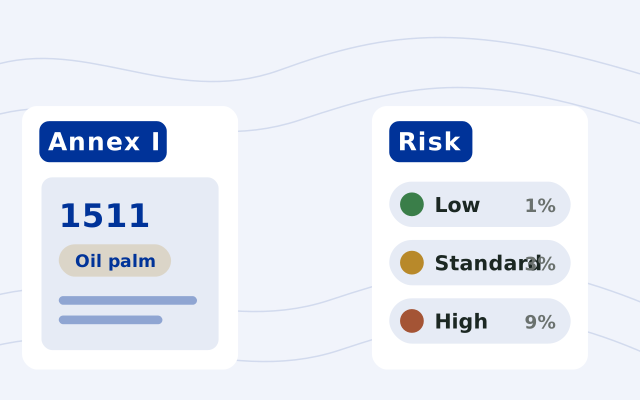
The products listed in Annex I of Regulation (EU) 2023/1115: 93 HS/CN codes across cattle, cocoa, coffee, oil palm, rubber, soya and wood, as amended in 2024, 2025 and 2026. Some are “ex” codes, where only the products described are covered. Delegated Regulation (EU) 2026/2102 removed leather, soya beans for sowing, used and retreaded tyres and vehicle and aircraft seats, and adds 18 products, such as soluble coffee and palm oleochemicals, from 30 December 2027. Type a code into the lookup to see where it falls.
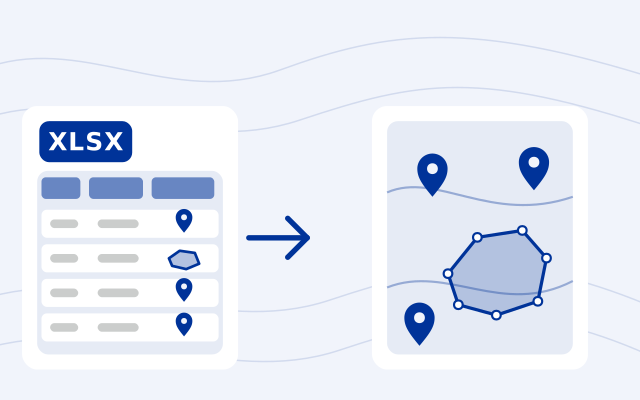
For a plot of more than 4 hectares, record a polygon: the outline of the plot, corner by corner, in order. For 4 hectares or less, one point with its latitude and longitude is enough, though a polygon works for a small plot too. Cattle are the exception: one point per establishment, and every establishment where the animals were kept.
The EU's GeoJSON file description asks for WGS84 coordinates, longitude first, cut to six decimals. Plots are Points, MultiPoints, Polygons, MultiPolygons or GeometryCollections; lines aren't accepted, polygons must be closed, and polygons with holes or crossing outlines aren't processed. The only properties read are ProducerName, ProducerCountry (a two-letter ISO code), ProductionPlace and Area (hectares, as a number), and their names are case-sensitive. A point with no Area counts as 4 hectares, and one statement takes at most 25 MB of GeoJSON.
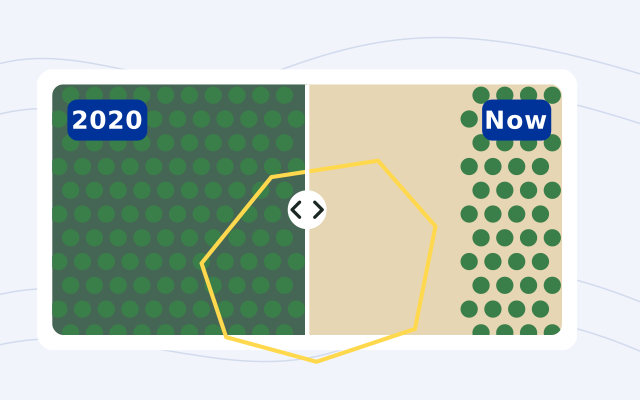
No. It only puts two satellite pictures side by side: one from the last six months of 2020, before the EUDR cutoff of 31 December 2020, and one from the last six months. It doesn't detect forest loss, score plots or decide whether they meet the regulation. You look at each plot and decide what needs a closer check.
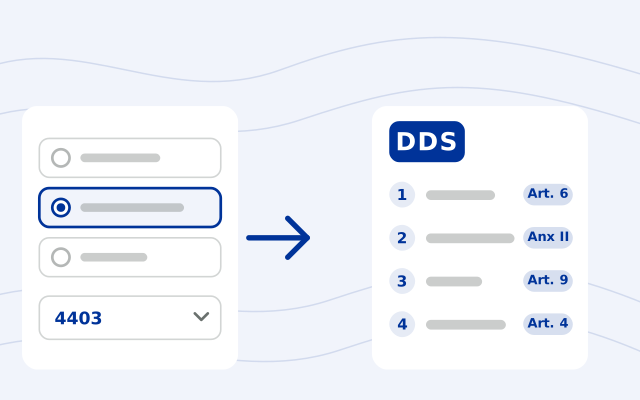
Annex II of the EUDR lists it: your name and address, and your EORI number when the products enter or leave the EU market; the HS code, a description with the trade name (and the full scientific name for wood) and the quantity (for Import or Export, net mass in kilograms plus the supplementary unit where the code has one; for Domestic, net mass with a percentage estimate or deviation, or a volume or number of items); the country of production and the geolocation of every plot of land, or for cattle every establishment; and your confirmation that you exercised due diligence and found no or only a negligible risk. In TRACES you also choose an activity (Import, Export or Domestic), give the area of each production place and can group earlier statements.
Not as of 6 November 2026. The last delay was Regulation (EU) 2025/2650. The rules apply from 30 December 2026. Qualifying micro and small operators, including natural persons, established as such by 31 December 2024 have until 30 June 2027, except for EUTR-listed products. Traders and downstream operators follow the December 2026 date.
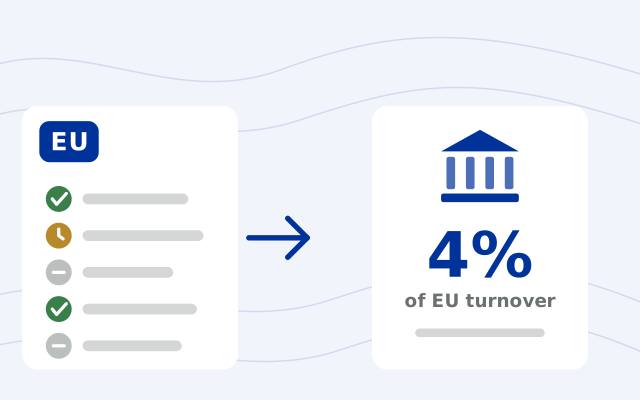
Each EU country sets them in its own law, which must provide at least what Article 25 requires: for a company, a maximum fine of at least 4% of its EU turnover, confiscation of the products and the revenue from them, up to 12 months' exclusion from public contracts and funding, and, for serious or repeated breaches, temporary bans on trading the products and a ban on simplified due diligence. As of 2 November 2026, 7 of the 27 countries have adopted a penalties law, and 3 of those are confirmed in force; we found no fine based on turnover in Belgium's or Lithuania's, and Denmark's sets no maximum.
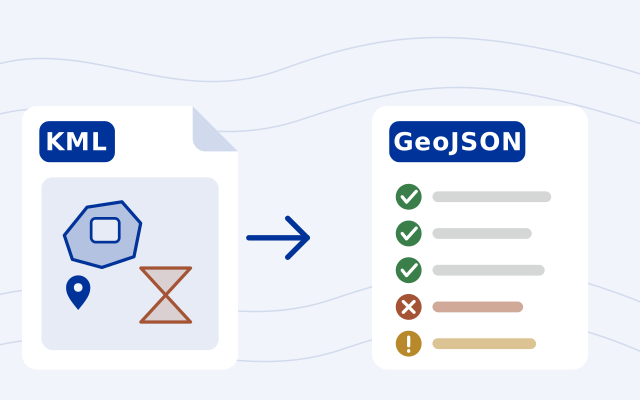
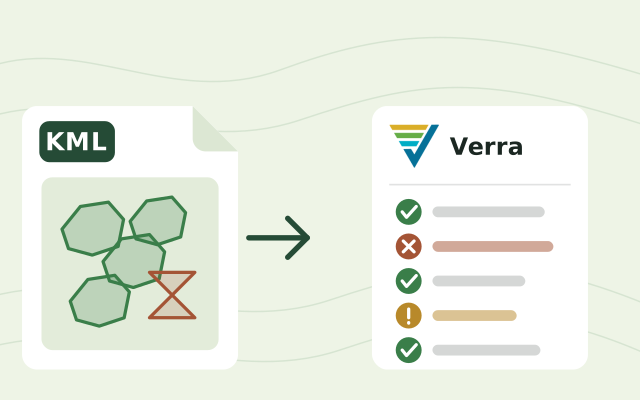
Under version 5.0 of Verra's geolocation file requirements, a project submits a KML or KMZ file (unless its methodology says otherwise) in WGS84 decimal degrees. It holds the project area with each project activity instance in named folders, plus project geodata, eligibility areas for grouped projects and land-rights areas where they apply. Each instance carries its ID, activity and implementation date; a point instance gives its coordinates, and a polygon gives its centroid and area in hectares. Shapes must be valid: no self-crossing outlines, overlaps or duplicates. The file goes in at registration, and an updated one at verification or crediting period renewal when instances or geodata are added, removed or reshaped, earlier information is corrected, or land-rights areas change. Always read Verra's own document for the full rules.
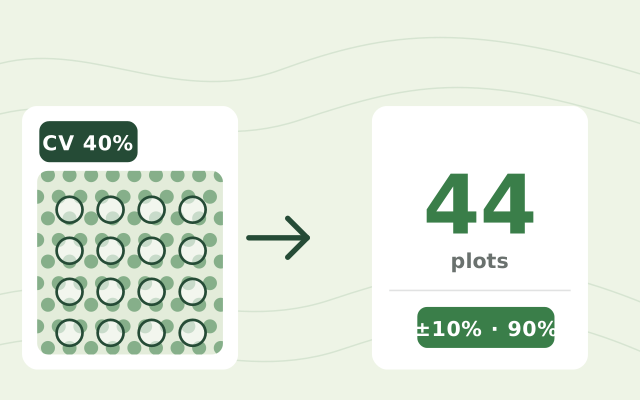
It depends on how much biomass varies between plots and the precision your standard asks for. The CDM sample-size tool (AR-TOOL03) gives n = (t × CV ÷ E)² for one stratum: with plots that vary by 40% of the mean, ±10% at 90% confidence needs (1.645 × 40 ÷ 10)² = 43.3, rounded up to 44 plots, and ±20% needs 14 once the small-sample t-value is used. IPCC guidance recommends 10% spare plots.
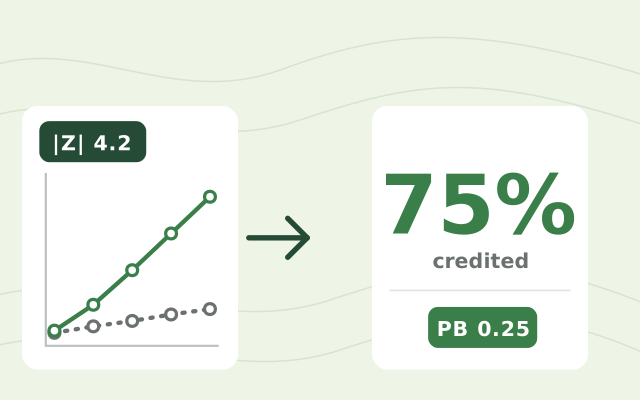
With a dynamic performance benchmark. Each project plot is matched to control plots outside the project that looked the same in satellite data before it started. At every verification the yearly growth in stocking index of both groups is compared with a Z test. If the project grew significantly faster (|Z| of 1.96 or more), the benchmark is the control slope divided by the project slope, and the rest of the measured growth can be credited.
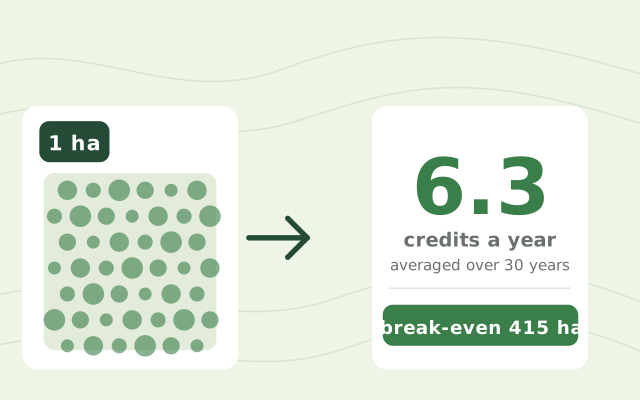
With IPCC default growth for the young tropical forests in the calculator and our example deductions, about 4 to 8 credits a hectare a year over the first 20 years, and fewer after. A fast plantation such as teak can earn about 12. Your own plots set the real number.
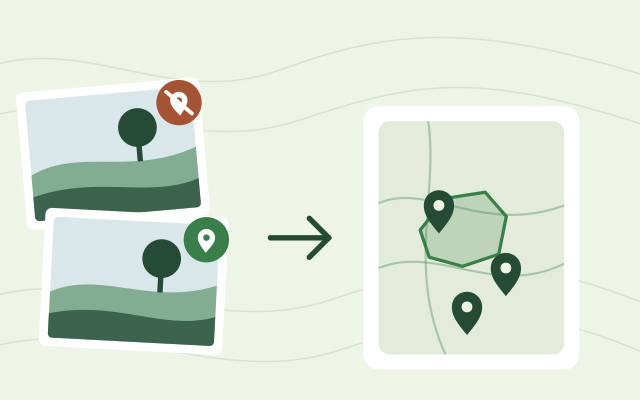
Most phones and cameras save the GPS position inside each photo, in its EXIF data. Drop the photos on the Geotagged Photo Map and each one appears as a pin where it was taken, with its coordinates and GPS accuracy.
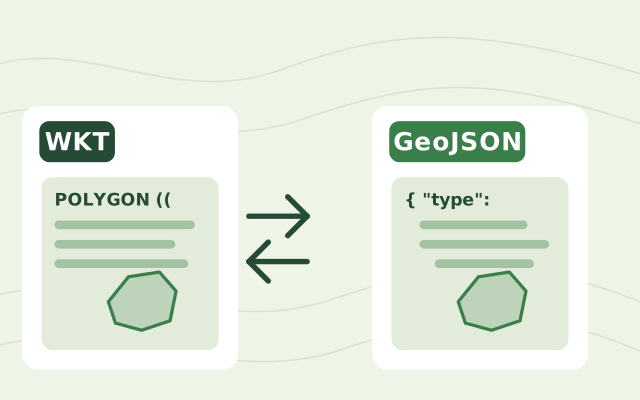
Both describe shapes such as points, lines and polygons. WKT (Well-Known Text) is a compact text format used by databases like PostGIS and by spreadsheets and exports. GeoJSON is a JSON format used by web maps and most mapping libraries. The coordinates are the same; only the wrapping differs.
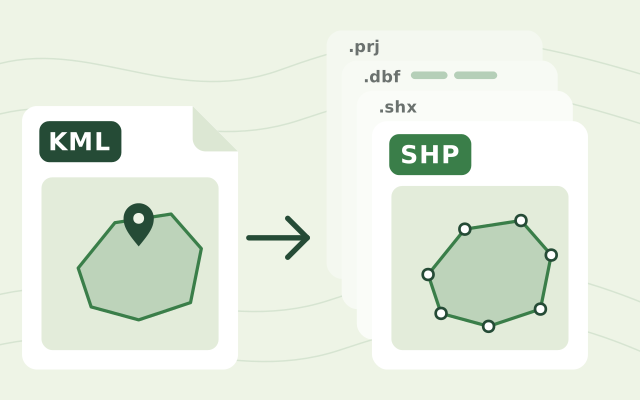
Drop the KML file on the KML to shapefile converter, check the shapes on the map, then download the zip. Unzip it and open the .shp file in QGIS or ArcGIS; keep the other files beside it, because together they make up the shapefile.
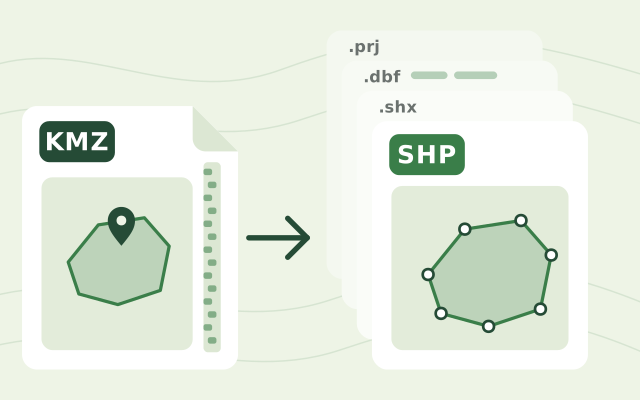
A KMZ is a zipped KML. It usually holds one main KML file, often doc.kml, plus any images or icons it uses. The converter reads that main KML; images and icons are not part of a shapefile.
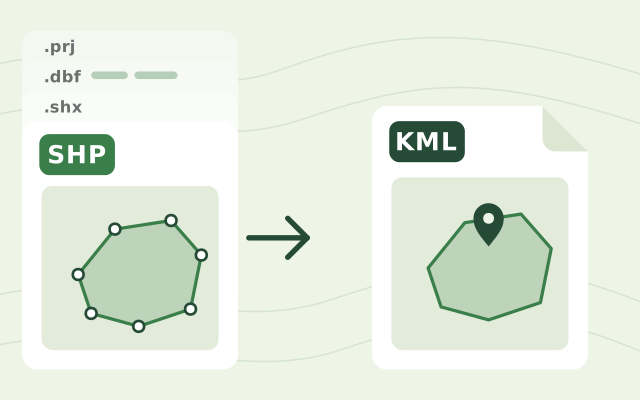
The .shp file holds the shapes and is required. Add the .dbf to keep the attributes and the .prj so the converter knows the coordinate system. A zip with all of them works too.
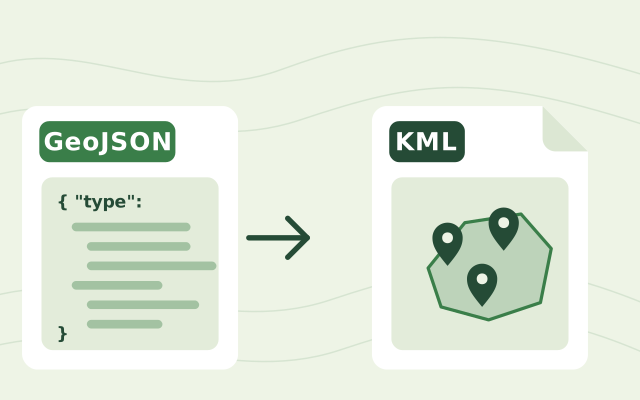
Drop the GeoJSON file on the GeoJSON to KML converter, check the shapes on the map and download the KML. It opens in Google Earth.
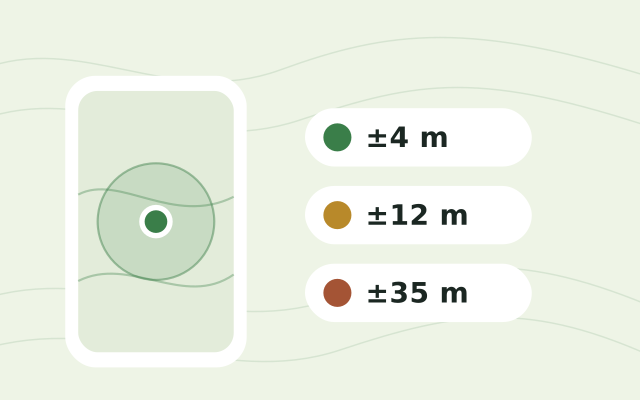
Under open sky most phones reach 3 to 5 metres. Under tree cover, near buildings or right after switching on it can be 10 to 30 metres or worse. The GPS Accuracy Test shows your live accuracy and how it changes, so you can wait until it settles before recording field data.
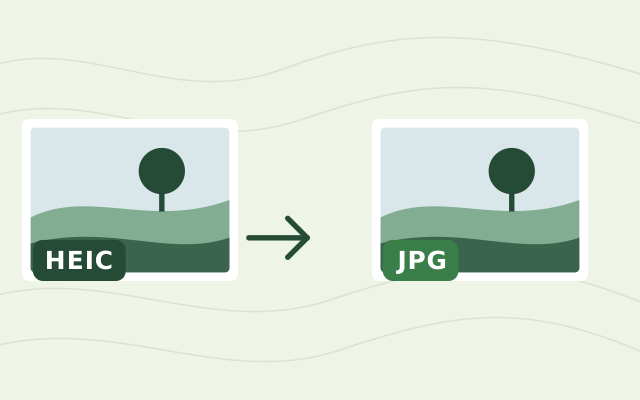
Drop the photos on the HEIC to JPEG converter. The conversion runs inside your browser, so the photos never leave your computer, and you can download them one by one or all at once.
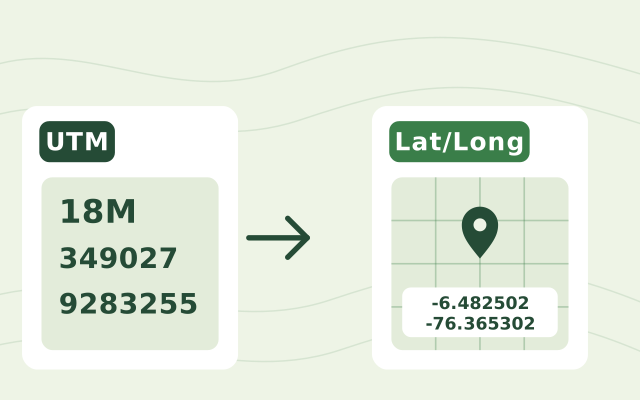
You need the zone number, the hemisphere or latitude band letter, the easting and the northing, for example 17T 630084 4833438. Paste them into the UTM to lat/long converter and it shows the latitude and longitude in decimal degrees and in degrees-minutes-seconds, with the point on a map.
Another question? Email us or book a call.
Bring in the spreadsheets, field forms and maps you already use, and see every site in one place.