Restoration Scope
for Reforestation

Restoration work, connected across sites and seasons. Keep nurseries, planting sites, field teams and survival records in one system. Plan the season, follow the work and see which sites need attention.
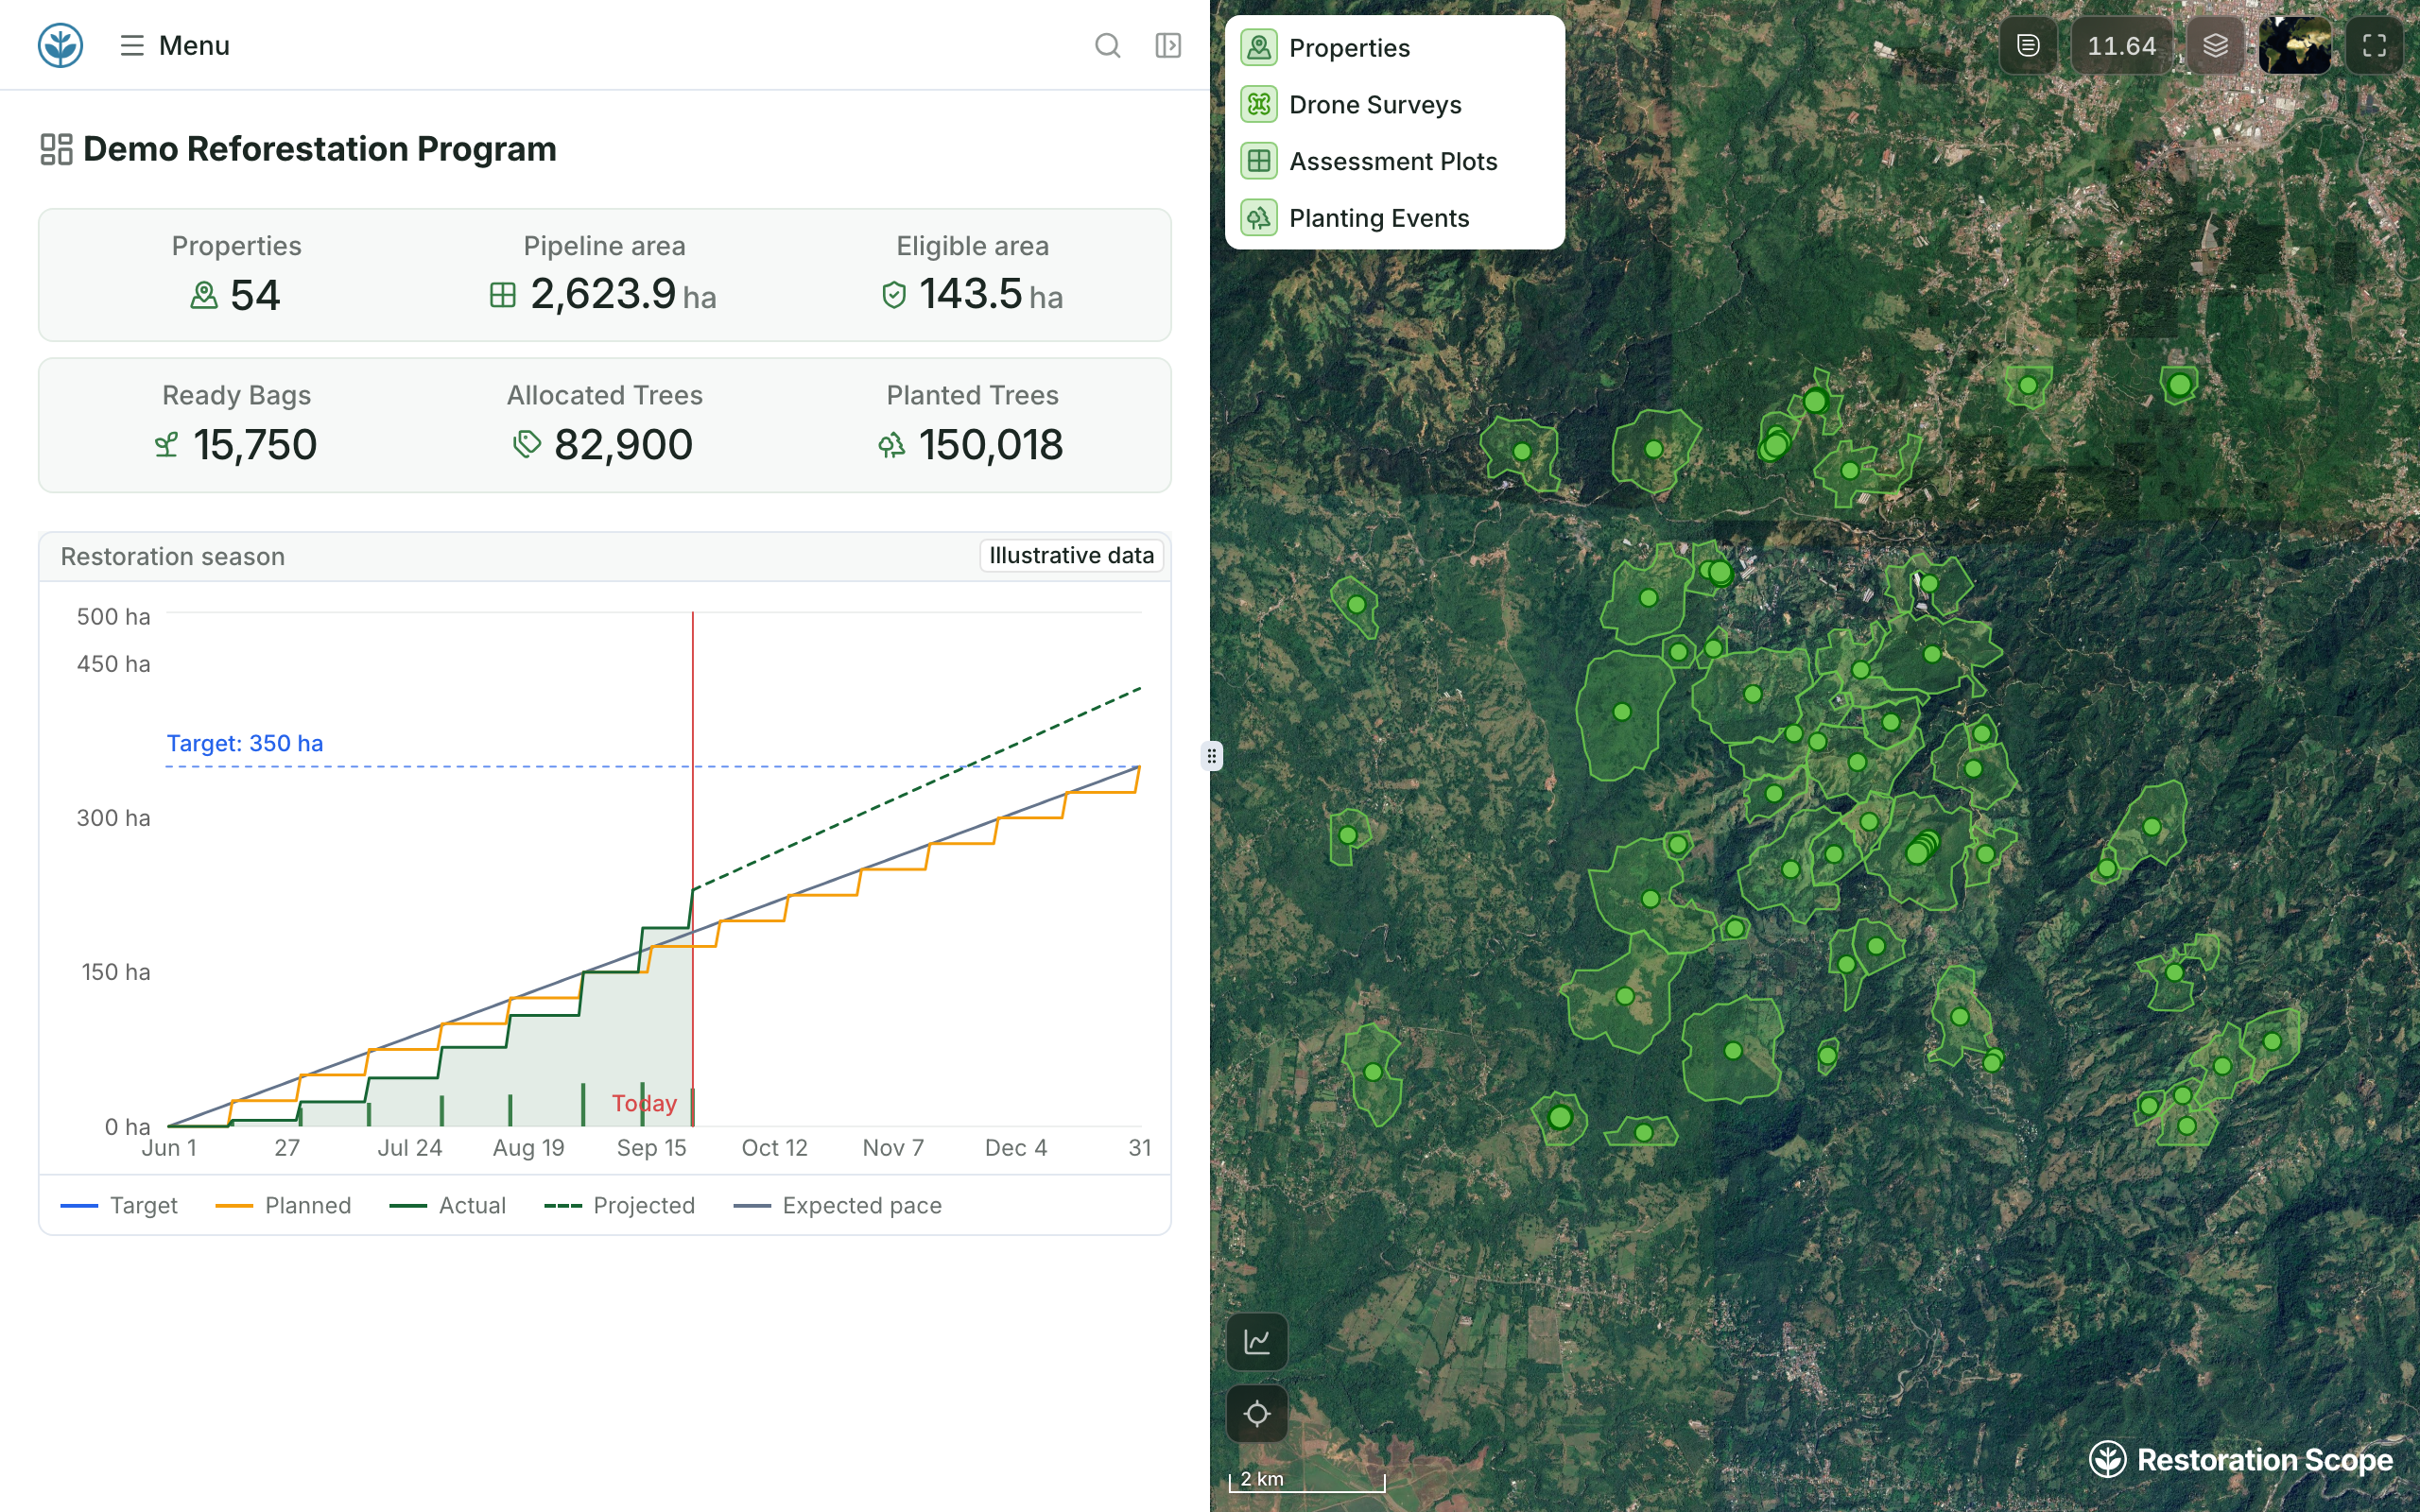

Demo programme dashboard with the restoration season’s planned and actual hectares beside the planting sites map

Built with reforestation teams

Every stage of a reforestation project.

From finding land to counting surviving trees, every step uses the same sites, teams and records.

  1. Land acquisition

    • Property records
    • Land eligibility
    • Landowner enrollment
    • Contracts
    • Documents
  2. Evaluation

    • Drone surveys
    • Geospatial analysis
    • Baseline surveys
    • Soil surveys
  3. Planning

    • Season timelines
    • Planting maps
    • Nurseries and seed banks
    • Seed and sapling plans
    • Carbon projections
  4. Implementation

    • Field staff and crews
    • Daily operations
    • Real-time progress
    • Quality control
  5. Monitoring

    • Monitoring plots
    • Tree tracking and sampling
    • Survival rates
    • Maintenance

From planting plans to surviving trees.

Keep each site connected to the people, activities and observations behind it.

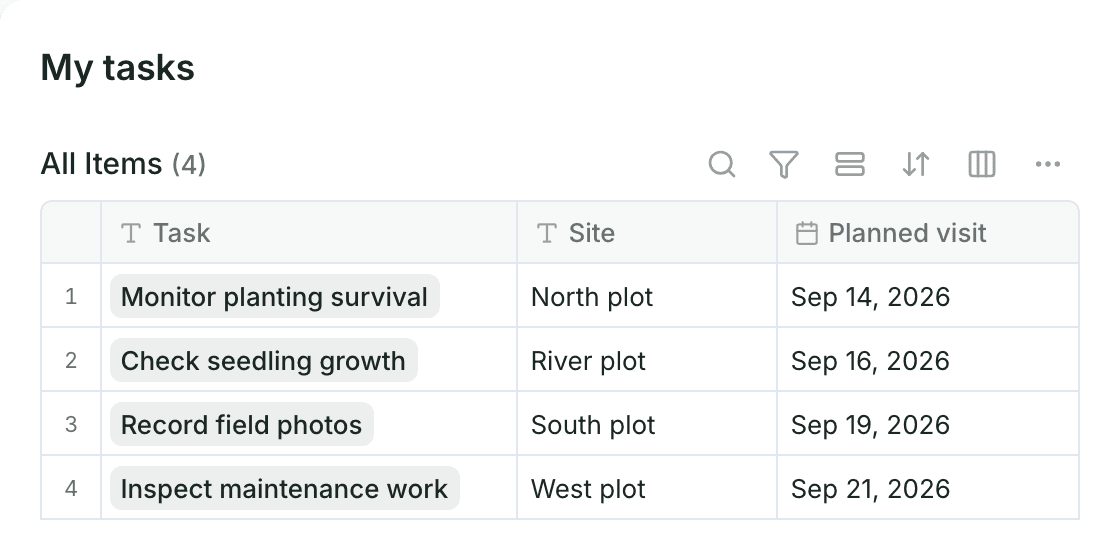
Example task list: planned visits to check survival, seedling growth, field photos and maintenance at four plots

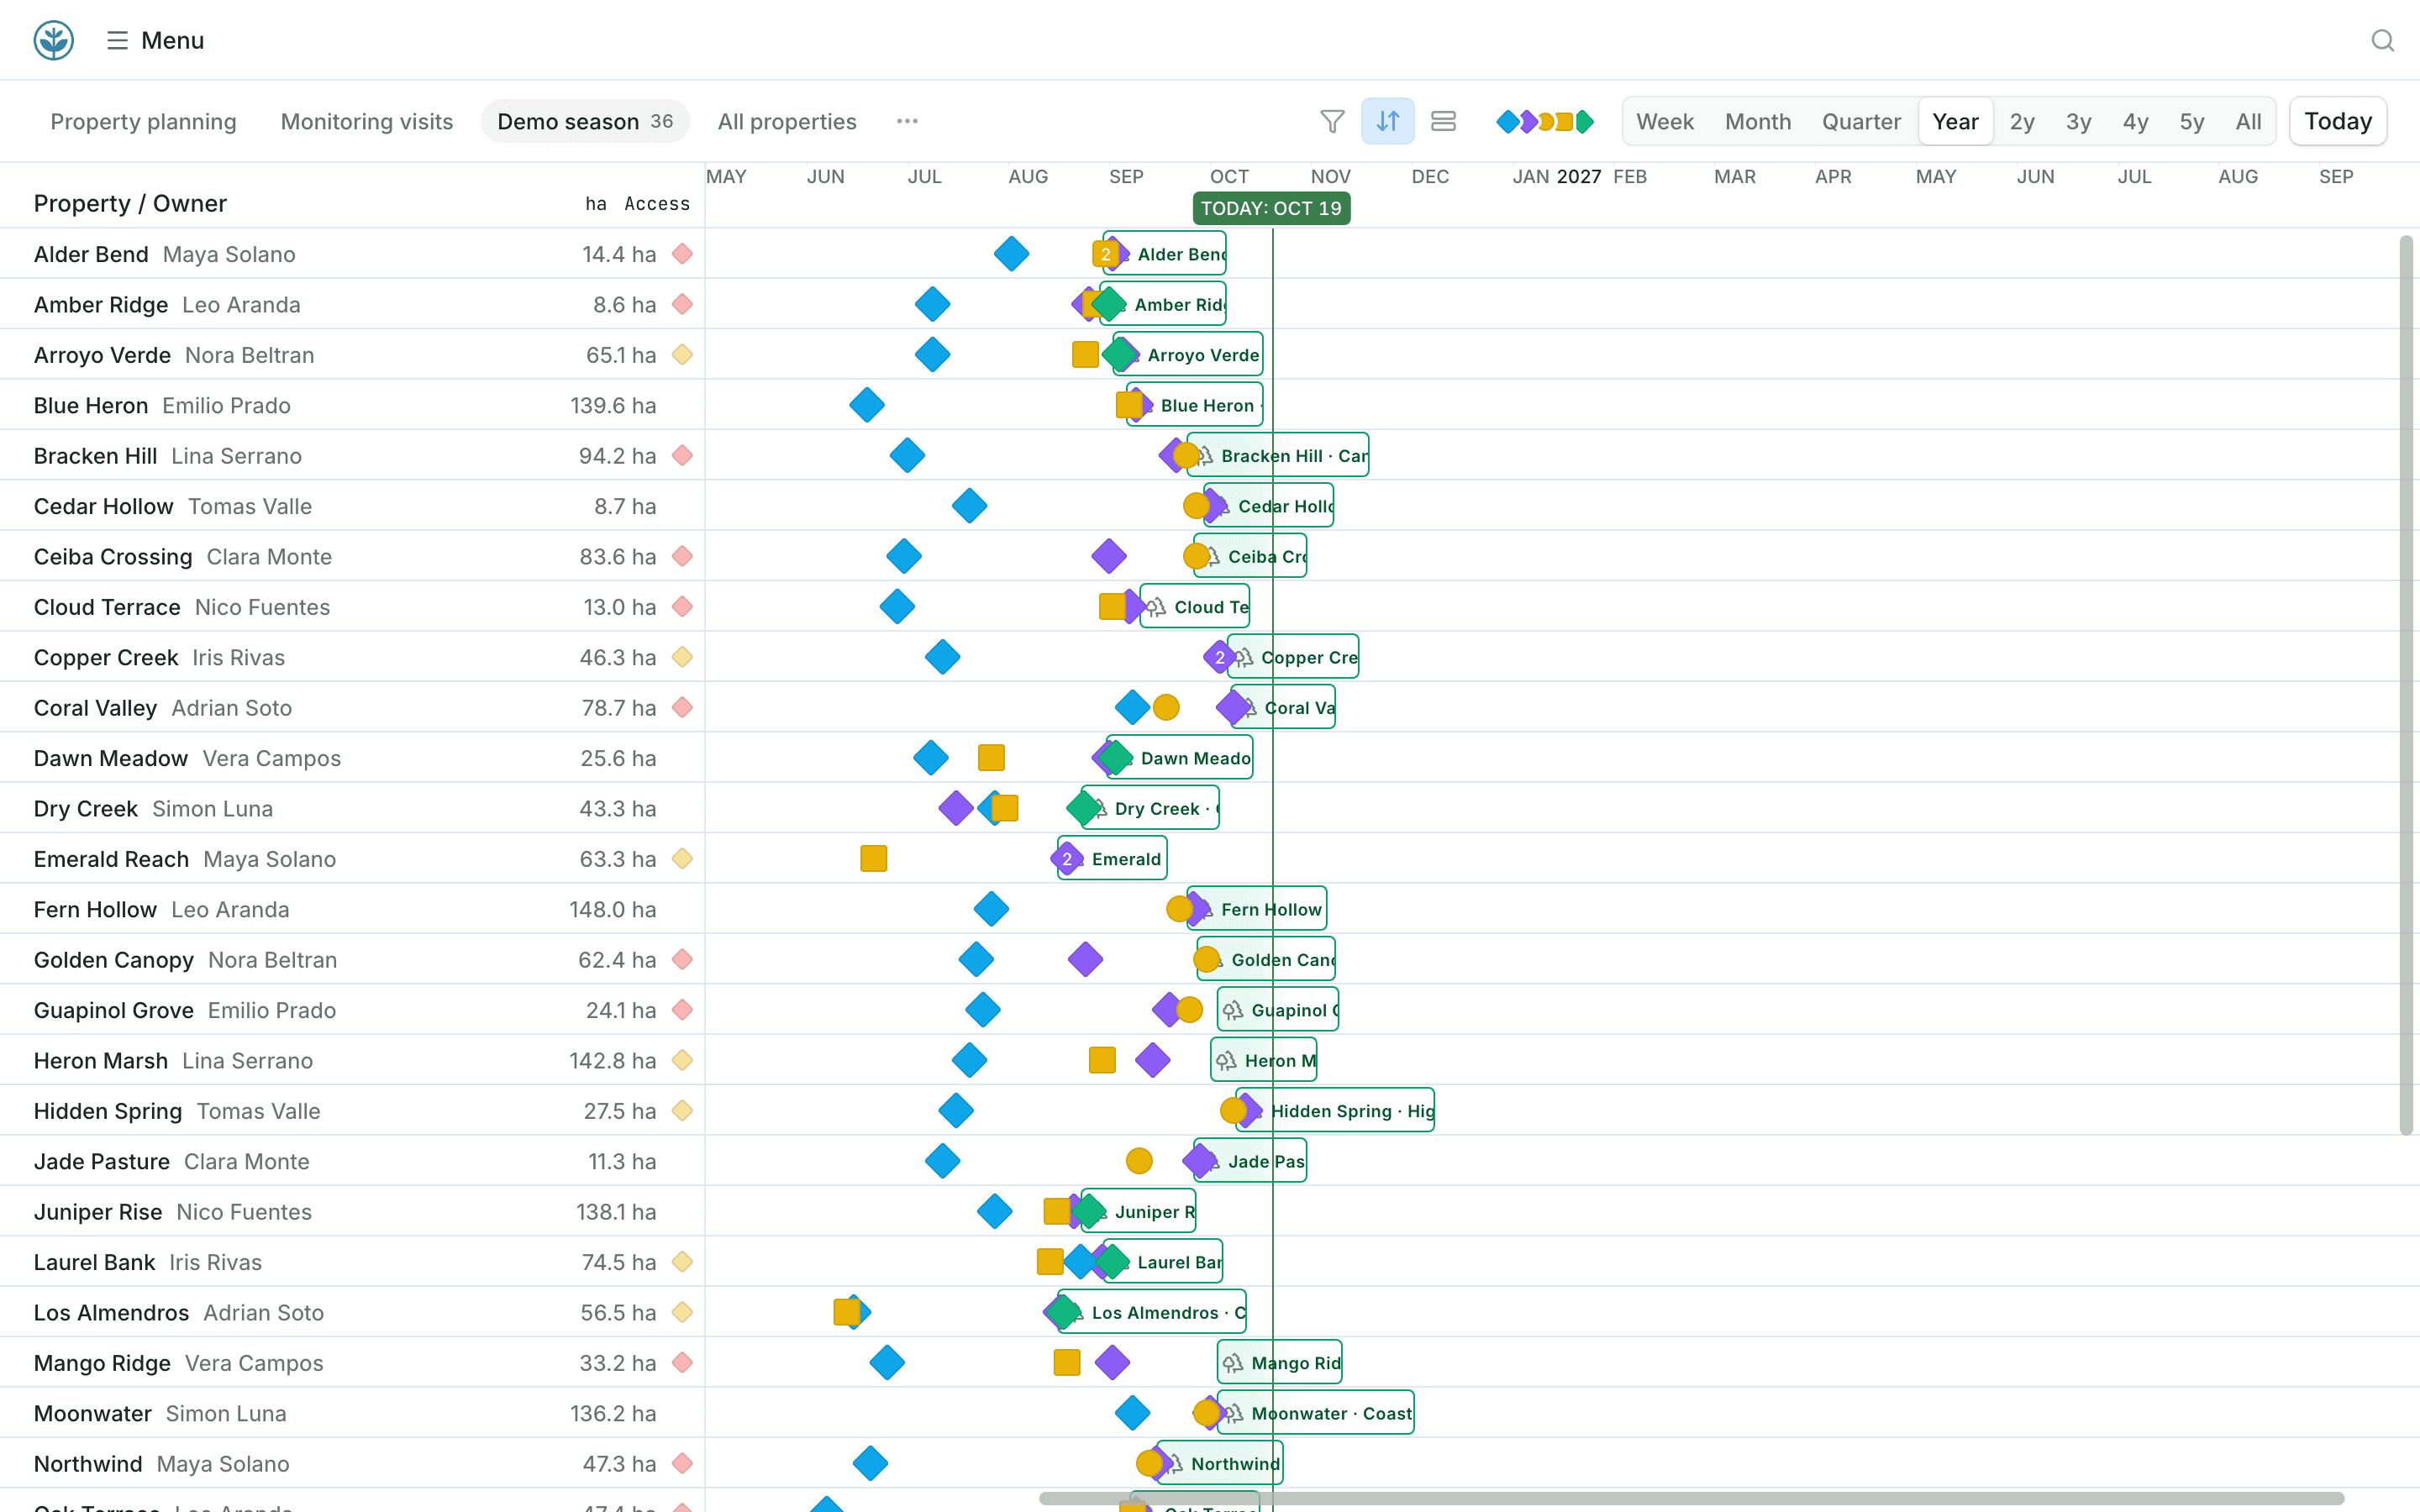
Plan the season across your sites.

See every planting site with its status and assigned nursery. Give coordinators the field visits scheduled across teams and sites.
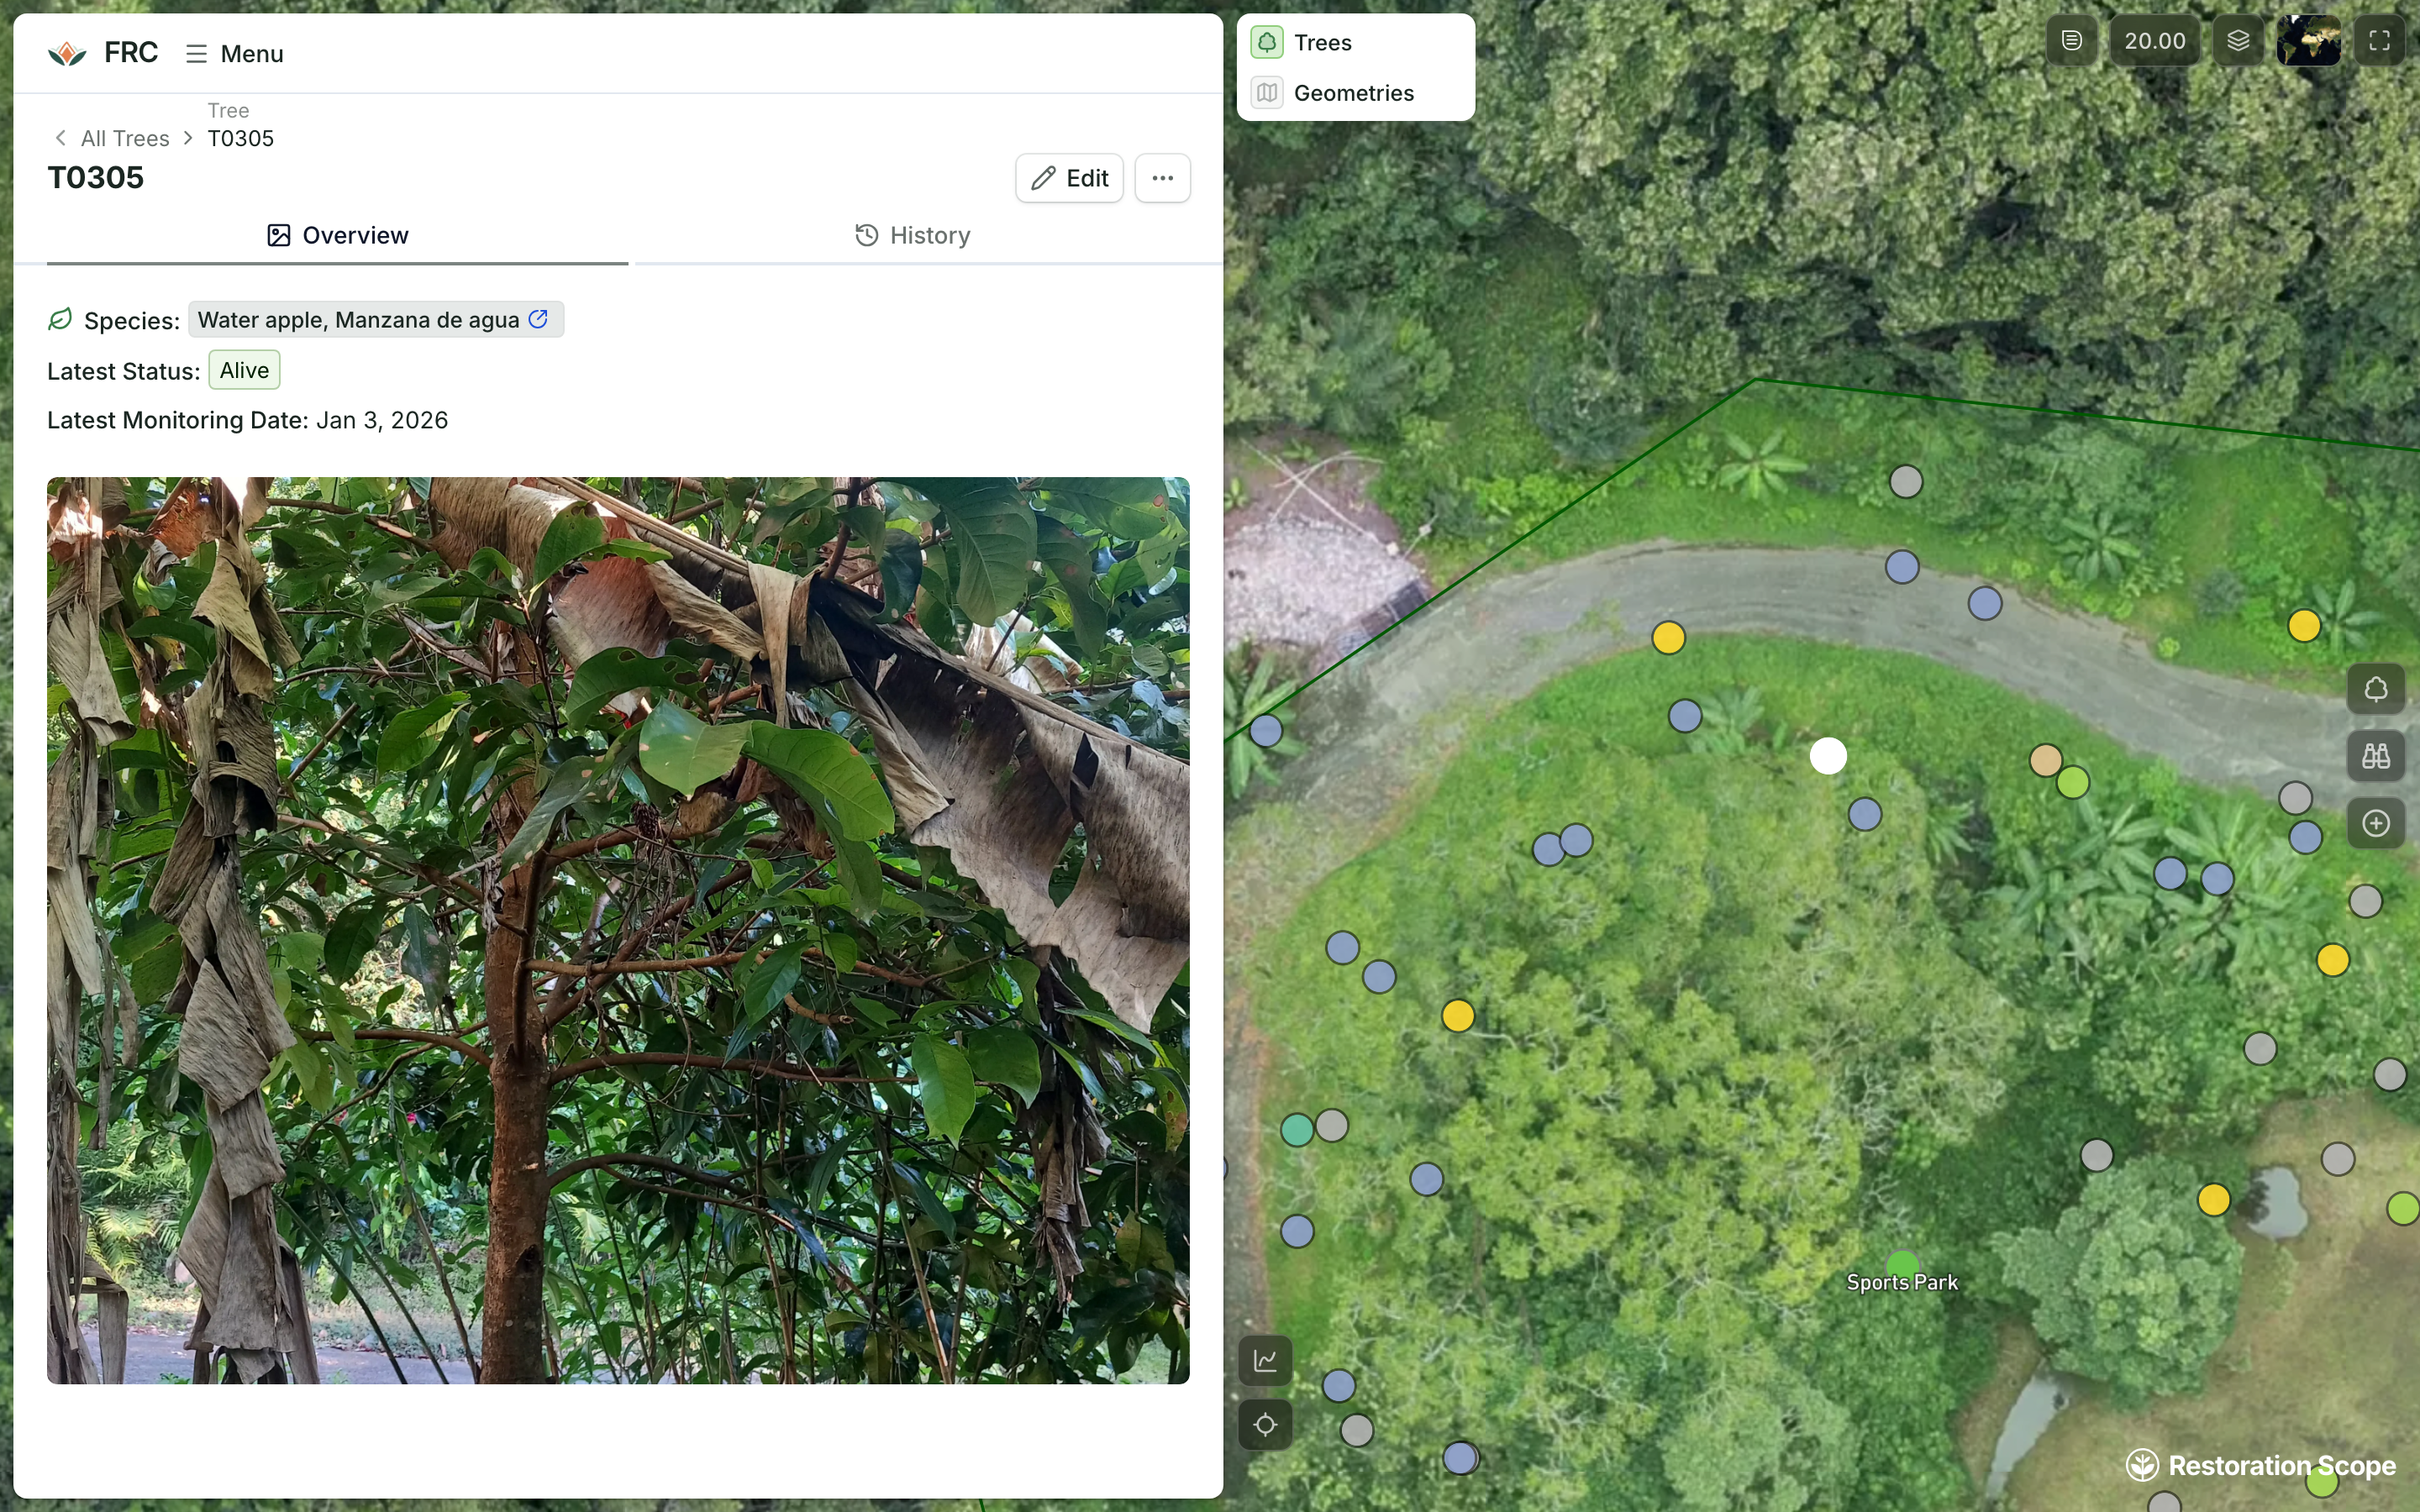
Alegría FRC tree T0305: its field photo, species and latest status beside the drone image of the site with every tree as a point
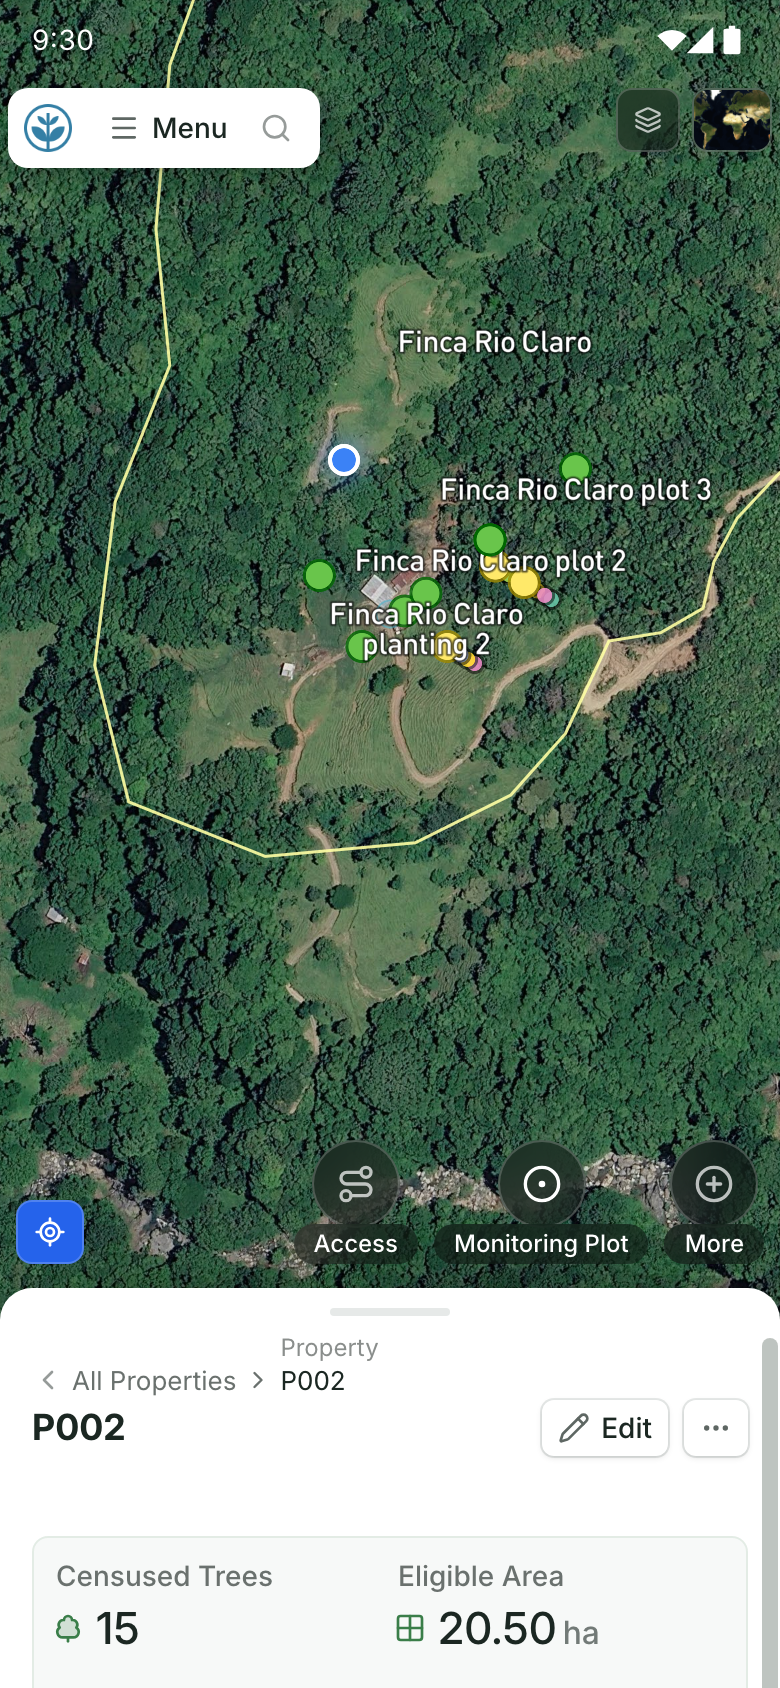
Demo property P002 on a phone: the blue position dot inside the farm boundary, among its planting sites and monitoring plots on the satellite map, with buttons to add access, a monitoring plot and more above the record

Bring field records back to the map.

Capture planting activities and observations against the right site or farm, even without signal. Field photos land on the map, where coordinators review them while the work is underway.
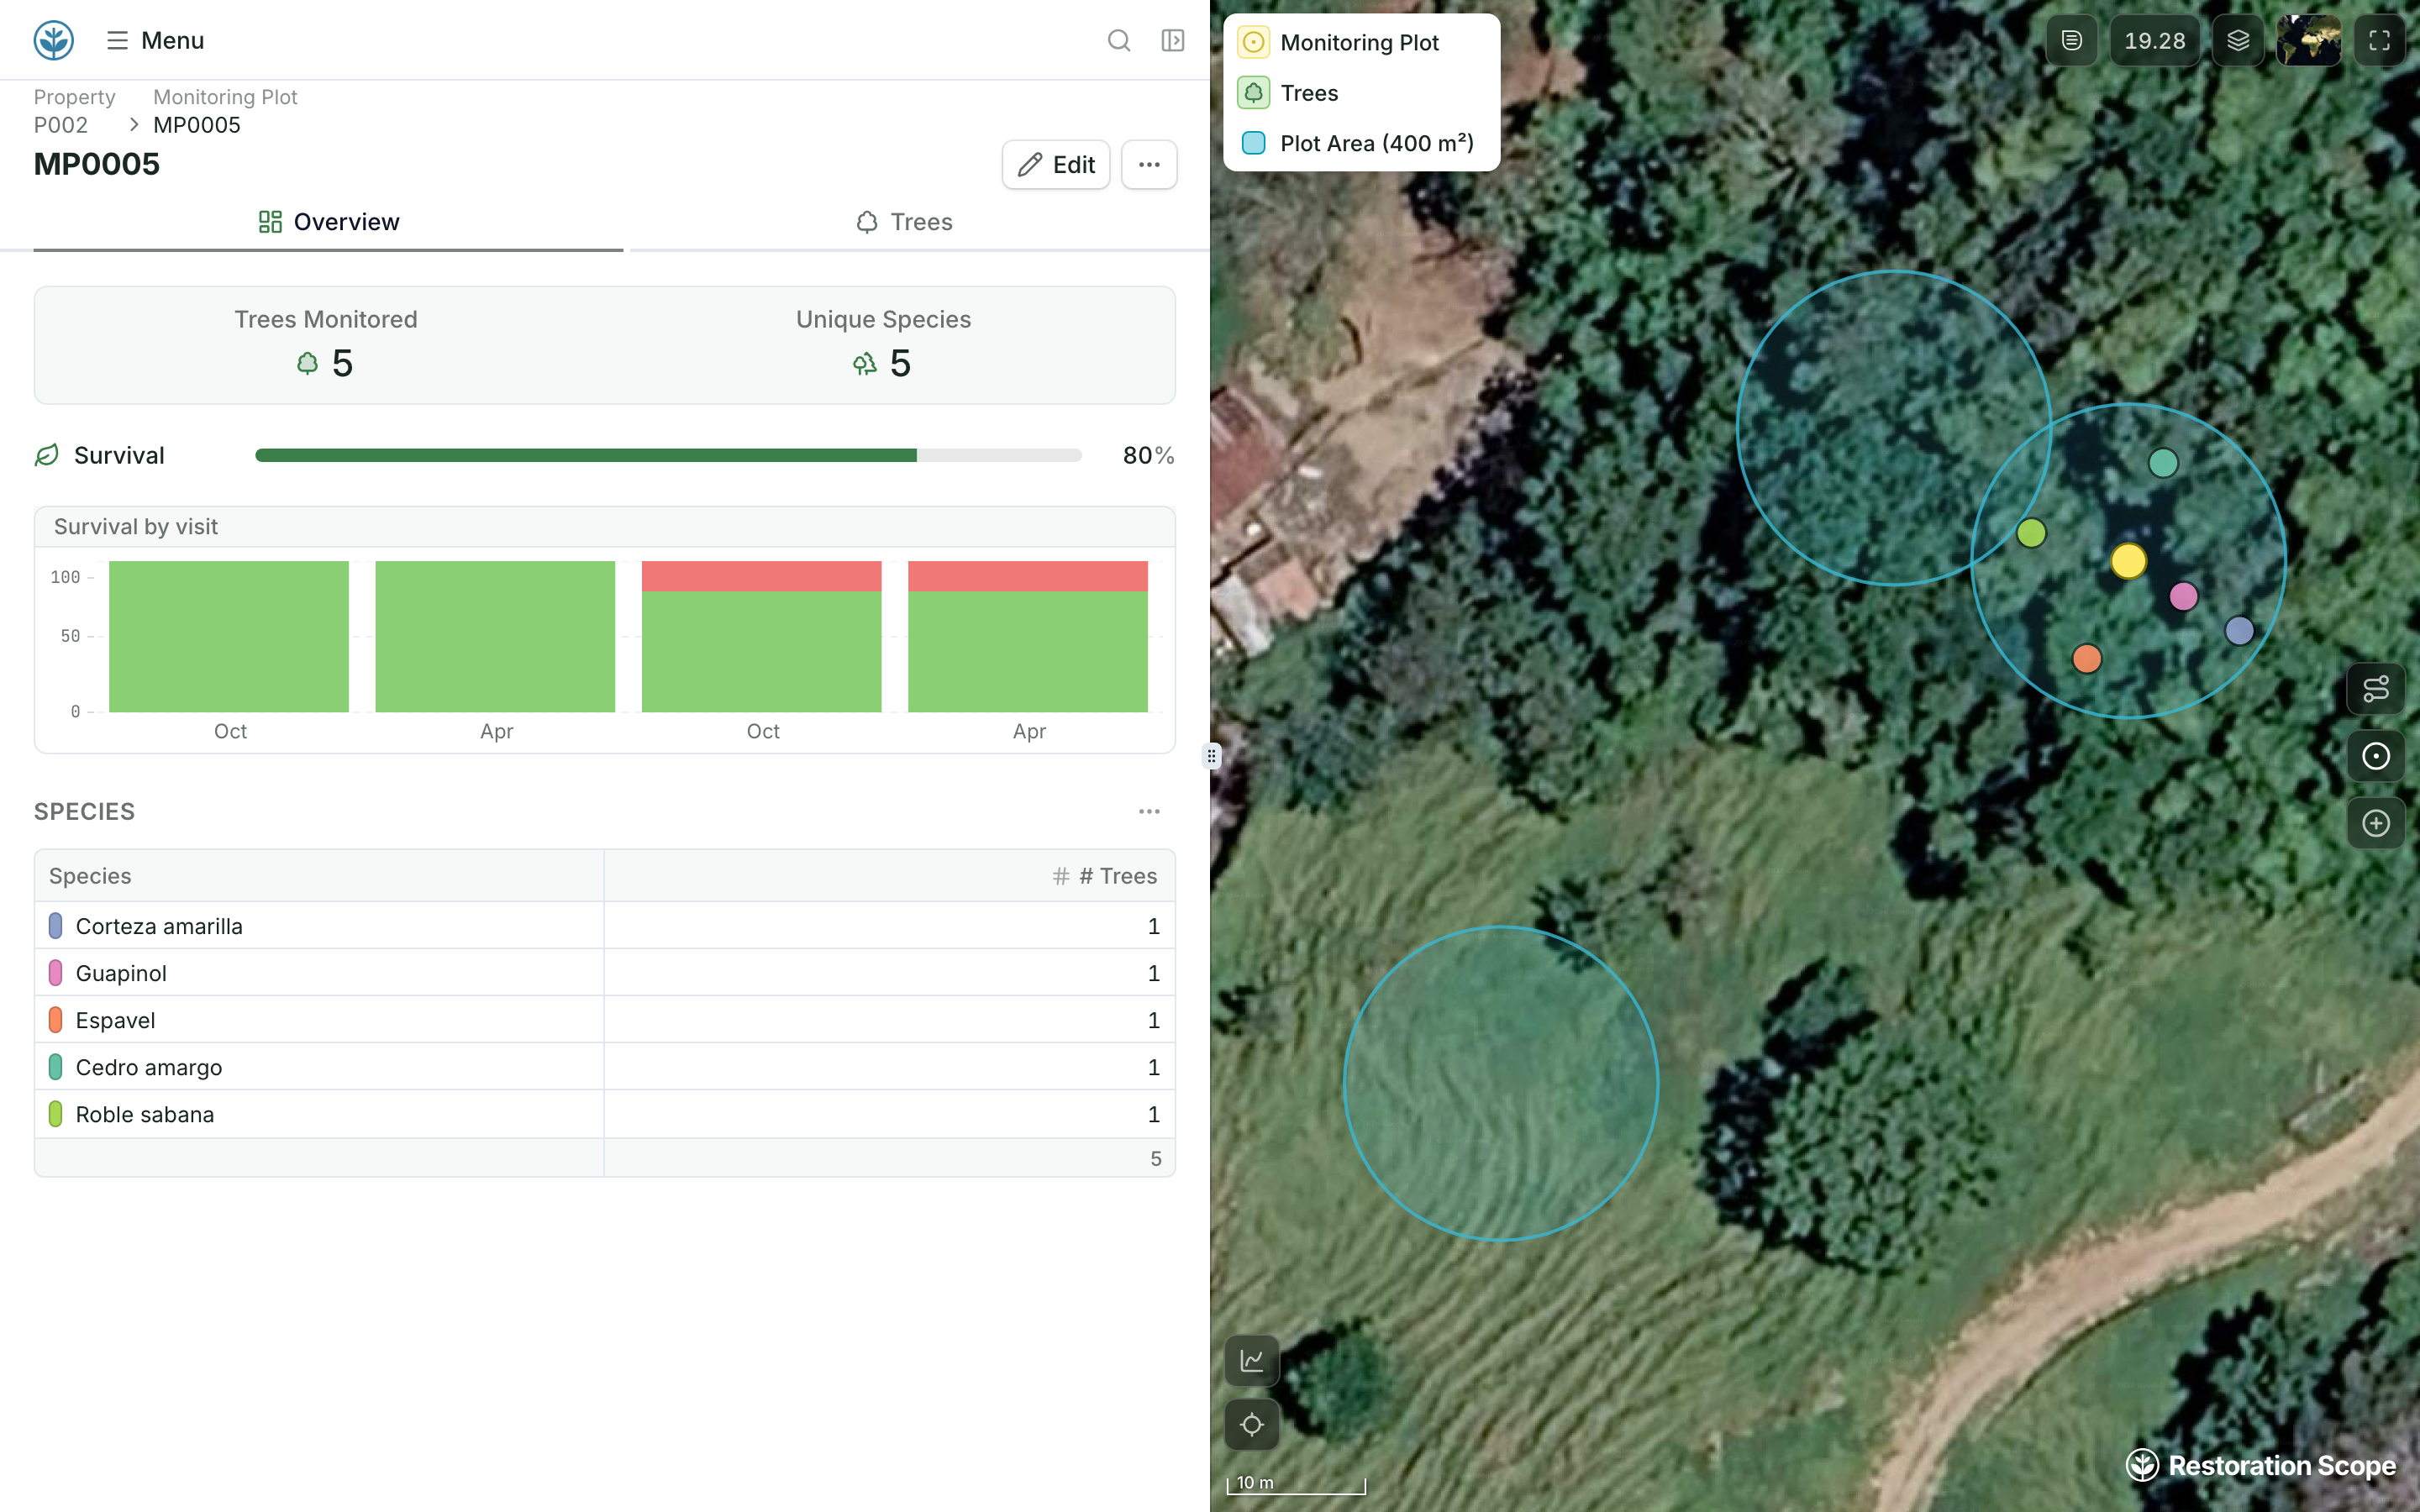
Demo monitoring plot MP0005 on farm P002: 80% survival, a survival-by-visit chart where one of its five trees dies after the second visit, and its species, beside its plot circle and two neighbouring 400 m² plots on the satellite map
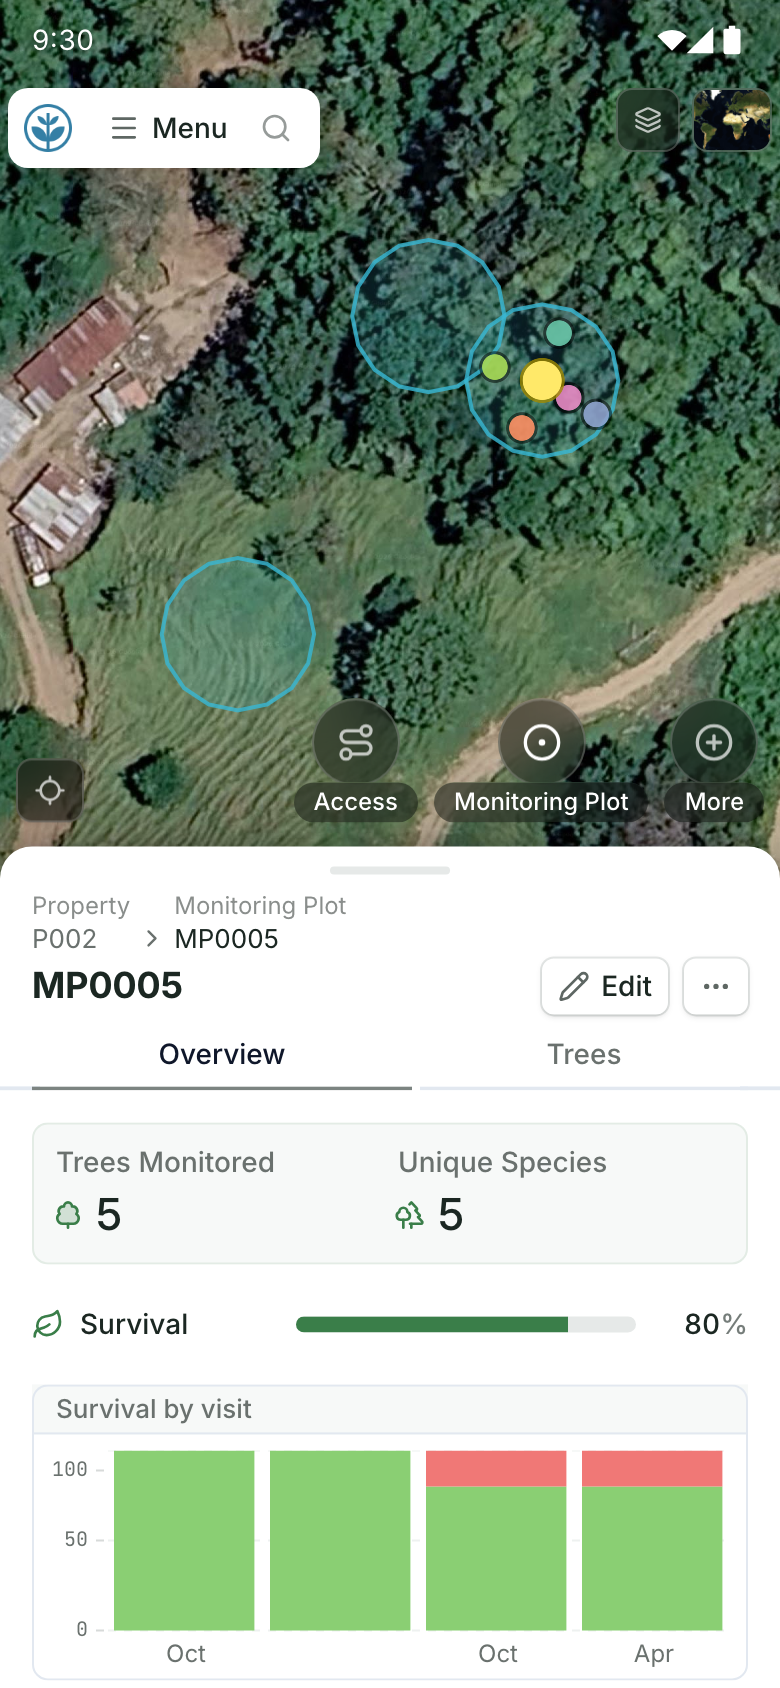
Demo monitoring plot MP0005 on a phone: its 400 m² plot circle and two neighbouring plots on the satellite map, above 80% survival and a survival-by-visit chart where one of its five trees dies after the second visit

Follow survival, not just planting.

Link repeated tree or plot observations to the original planting work. Review survival and maintenance records by site, species or season, and use them to plan follow-up visits.

Your project data, brought together.

Connect the tools, field records and geospatial sources your team already uses.

KoboToolbox
Google Sheets
Excel
QGIS
More connections
Explore data connections

Questions from restoration teams

Can we track individual trees and sample plots?

The records can be configured around individual trees, plots or planting areas. We define the relationships and observations with your team.

Can we keep our existing field forms?

We can connect records collected in tools such as Kobo or spreadsheets, and configure capture in the app where that suits the work.

Can different teams see different sites?

Permissions can be configured around responsibilities so teams work with the records relevant to them.

Does Restoration Scope Field work without signal?

Yes. Field teams record planting, tree observations and photos offline on iOS or Android, and the records sync when the phone reconnects.

Can we bring in records from past seasons?

Yes. Past planting and monitoring records come in from spreadsheets, Kobo exports or GIS files, so each site keeps its history.

Can funders see how the sites are doing?

When you choose. Donor portals and public pages show selected sites, maps and field photos, while internal records stay restricted.

Another question? Email us or book a call.

Updated

Connect your data, understand your operations.

Bring in the spreadsheets, field forms and maps you already use, and see every site in one place.