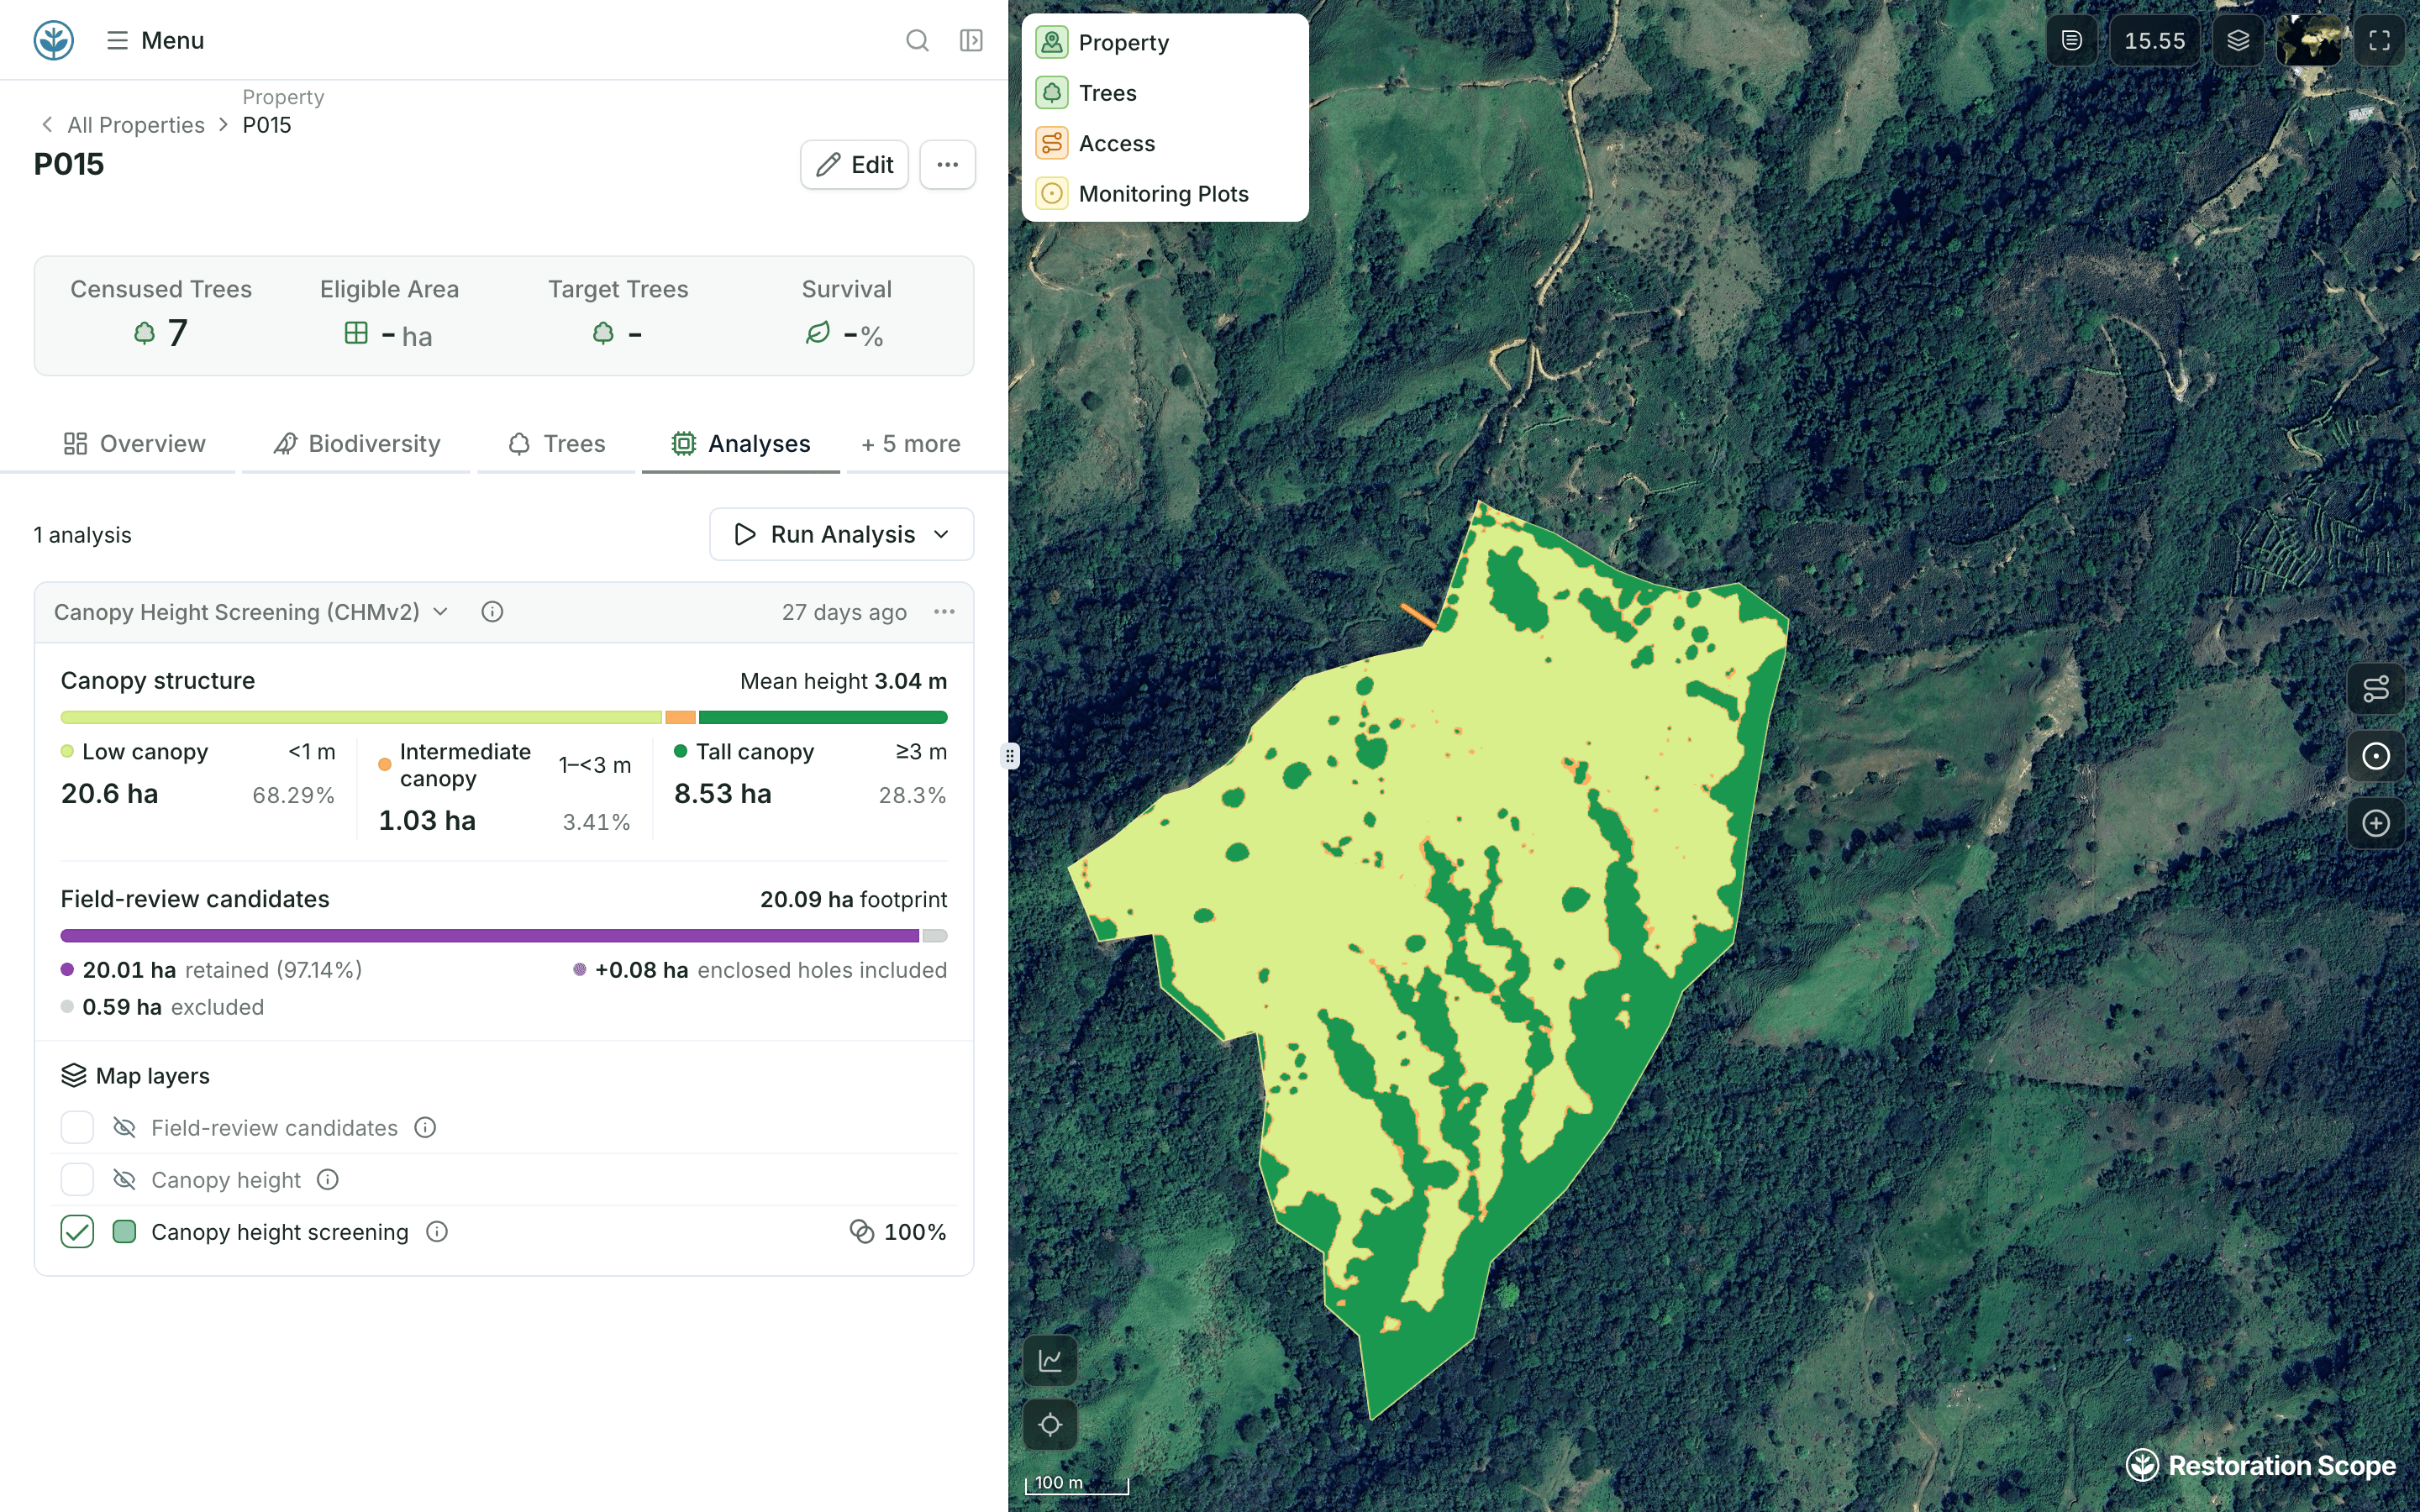
Canopy height map with the project boundary highlighted: 30.2 hectares, with 26.7% canopy above three meters.

Your geospatial methods.
Working at scale.

We work with science and geospatial teams to turn project-specific methods into repeatable workflows, from a first prototype to processing across a portfolio.

Explore geospatial workflows

Set the trigger. We build the workflow.

Custom-built around your project’s data, methods and criteria.

Trigger

Record createdRecord updatedManual run

Workflow

Land eligibility
Property assessment
Change detection

Results

Updated fieldsMap layers

Property Assessment

Customized Geospatial workflow

Property 0130.2 ha
Boundary addedStart assessment
Canopy
Land cover
Terrain

Property assessment

Canopy height > 3 m

ClipFilterMeasure
Updated fields
Canopy > 3 m
26.7%
Area > 3 m
8.1 ha
Canopy Height map
Reforestable areaExample
Built around your team’s questions.

Your methods and data. Workflows we build together.

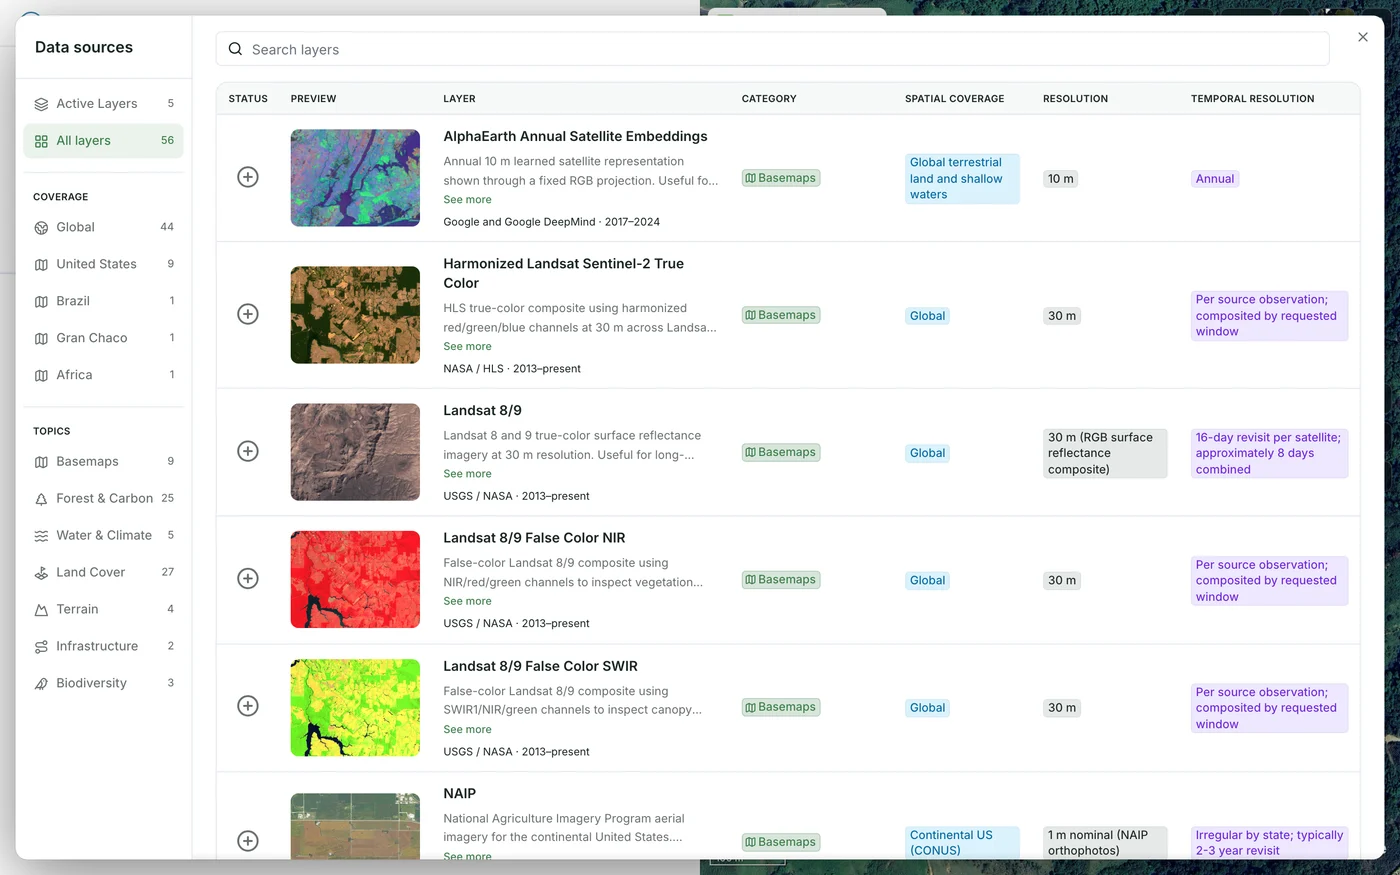
The demo map’s Data sources catalogue of map layers, filtered by coverage and topic, each with its preview, source, resolution and time span

Prototype your team’s method.

Work with us to turn your science and geospatial expertise into a working prototype. Define the inputs, processing steps and outputs together, test on representative sites, and refine the method with your team.

How we work with your team
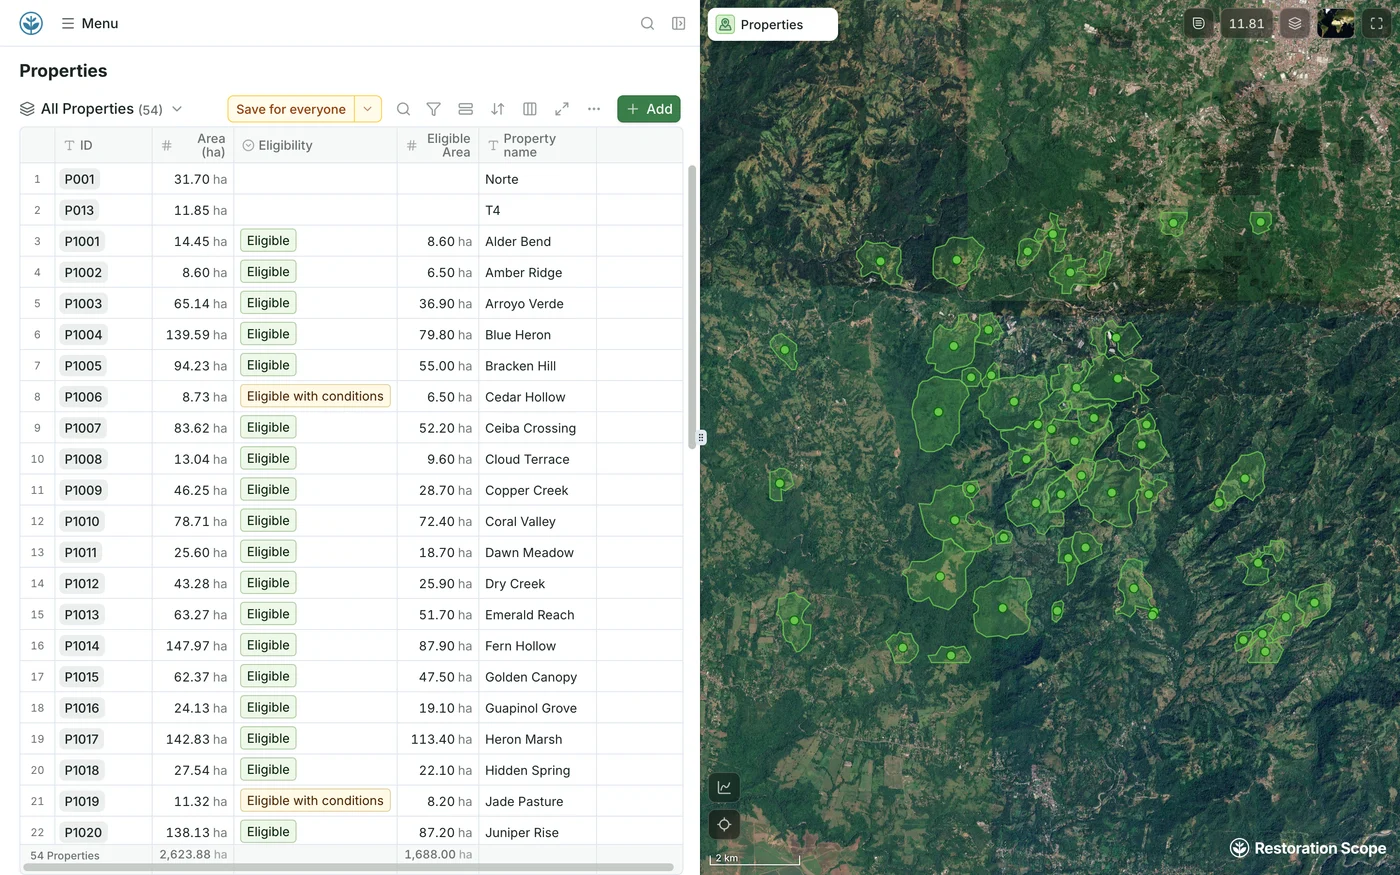
Demo portfolio of 54 properties: a table of each property’s area, eligibility and eligible area, beside all their boundaries on the satellite map

Run it across your project.

Turn the agreed method into repeatable workflows and processing pipelines. Consolidate geospatial layers, feed land eligibility flows, or prepare inputs for carbon monitoring—across individual sites or a whole portfolio.

Explore land eligibility
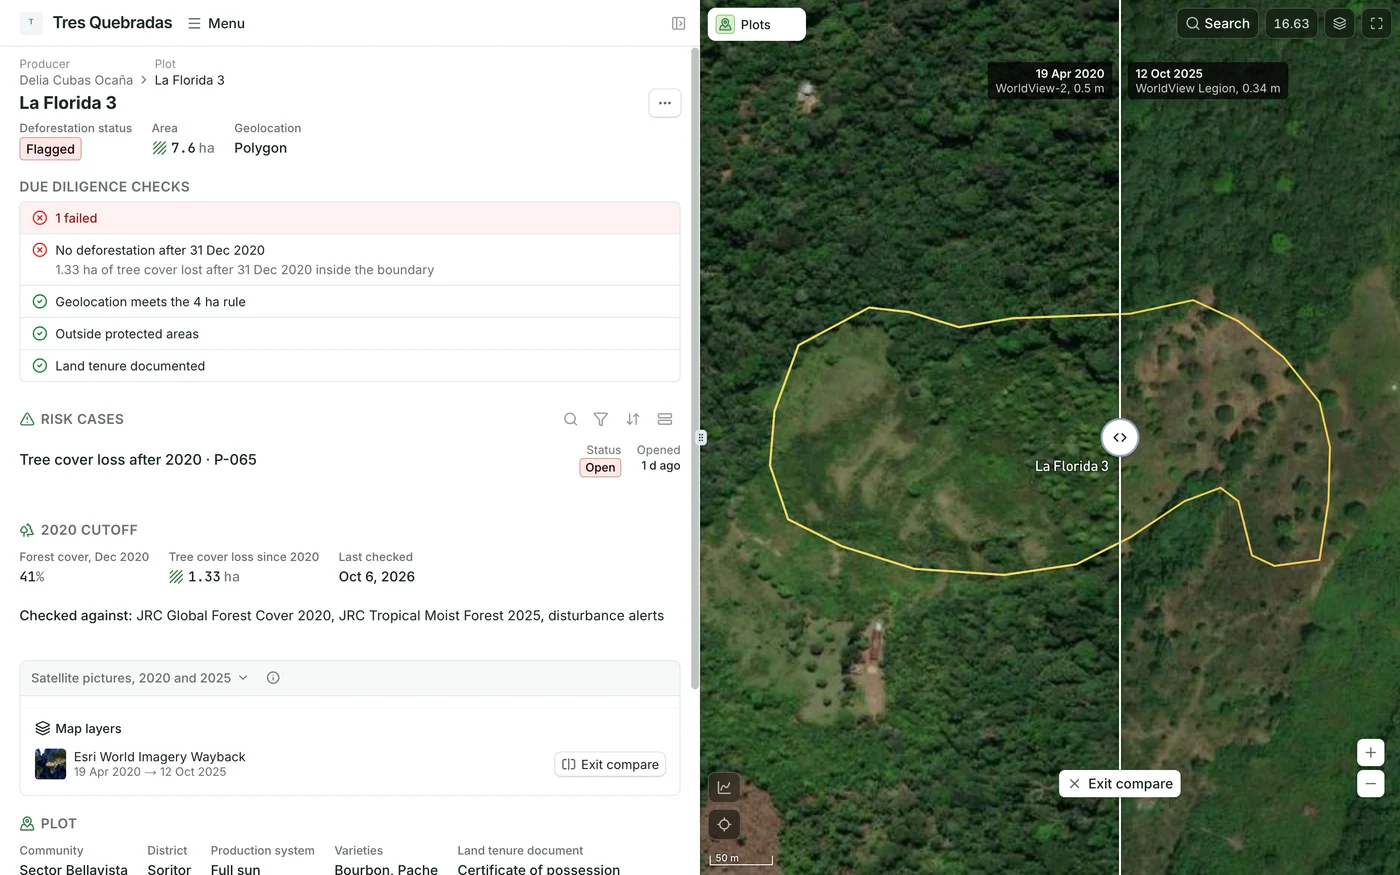
Demo plot La Florida 3: its failed 2020 deforestation check on the record, beside a swipe between 2020 and 2025 satellite images of the same boundary

Put the results to work.

Bring outputs back into the maps and records your team uses. Add information layers, compare basemaps to investigate land change, and connect monitoring results to the people making decisions.

Explore data layers

Analyses you can run today.

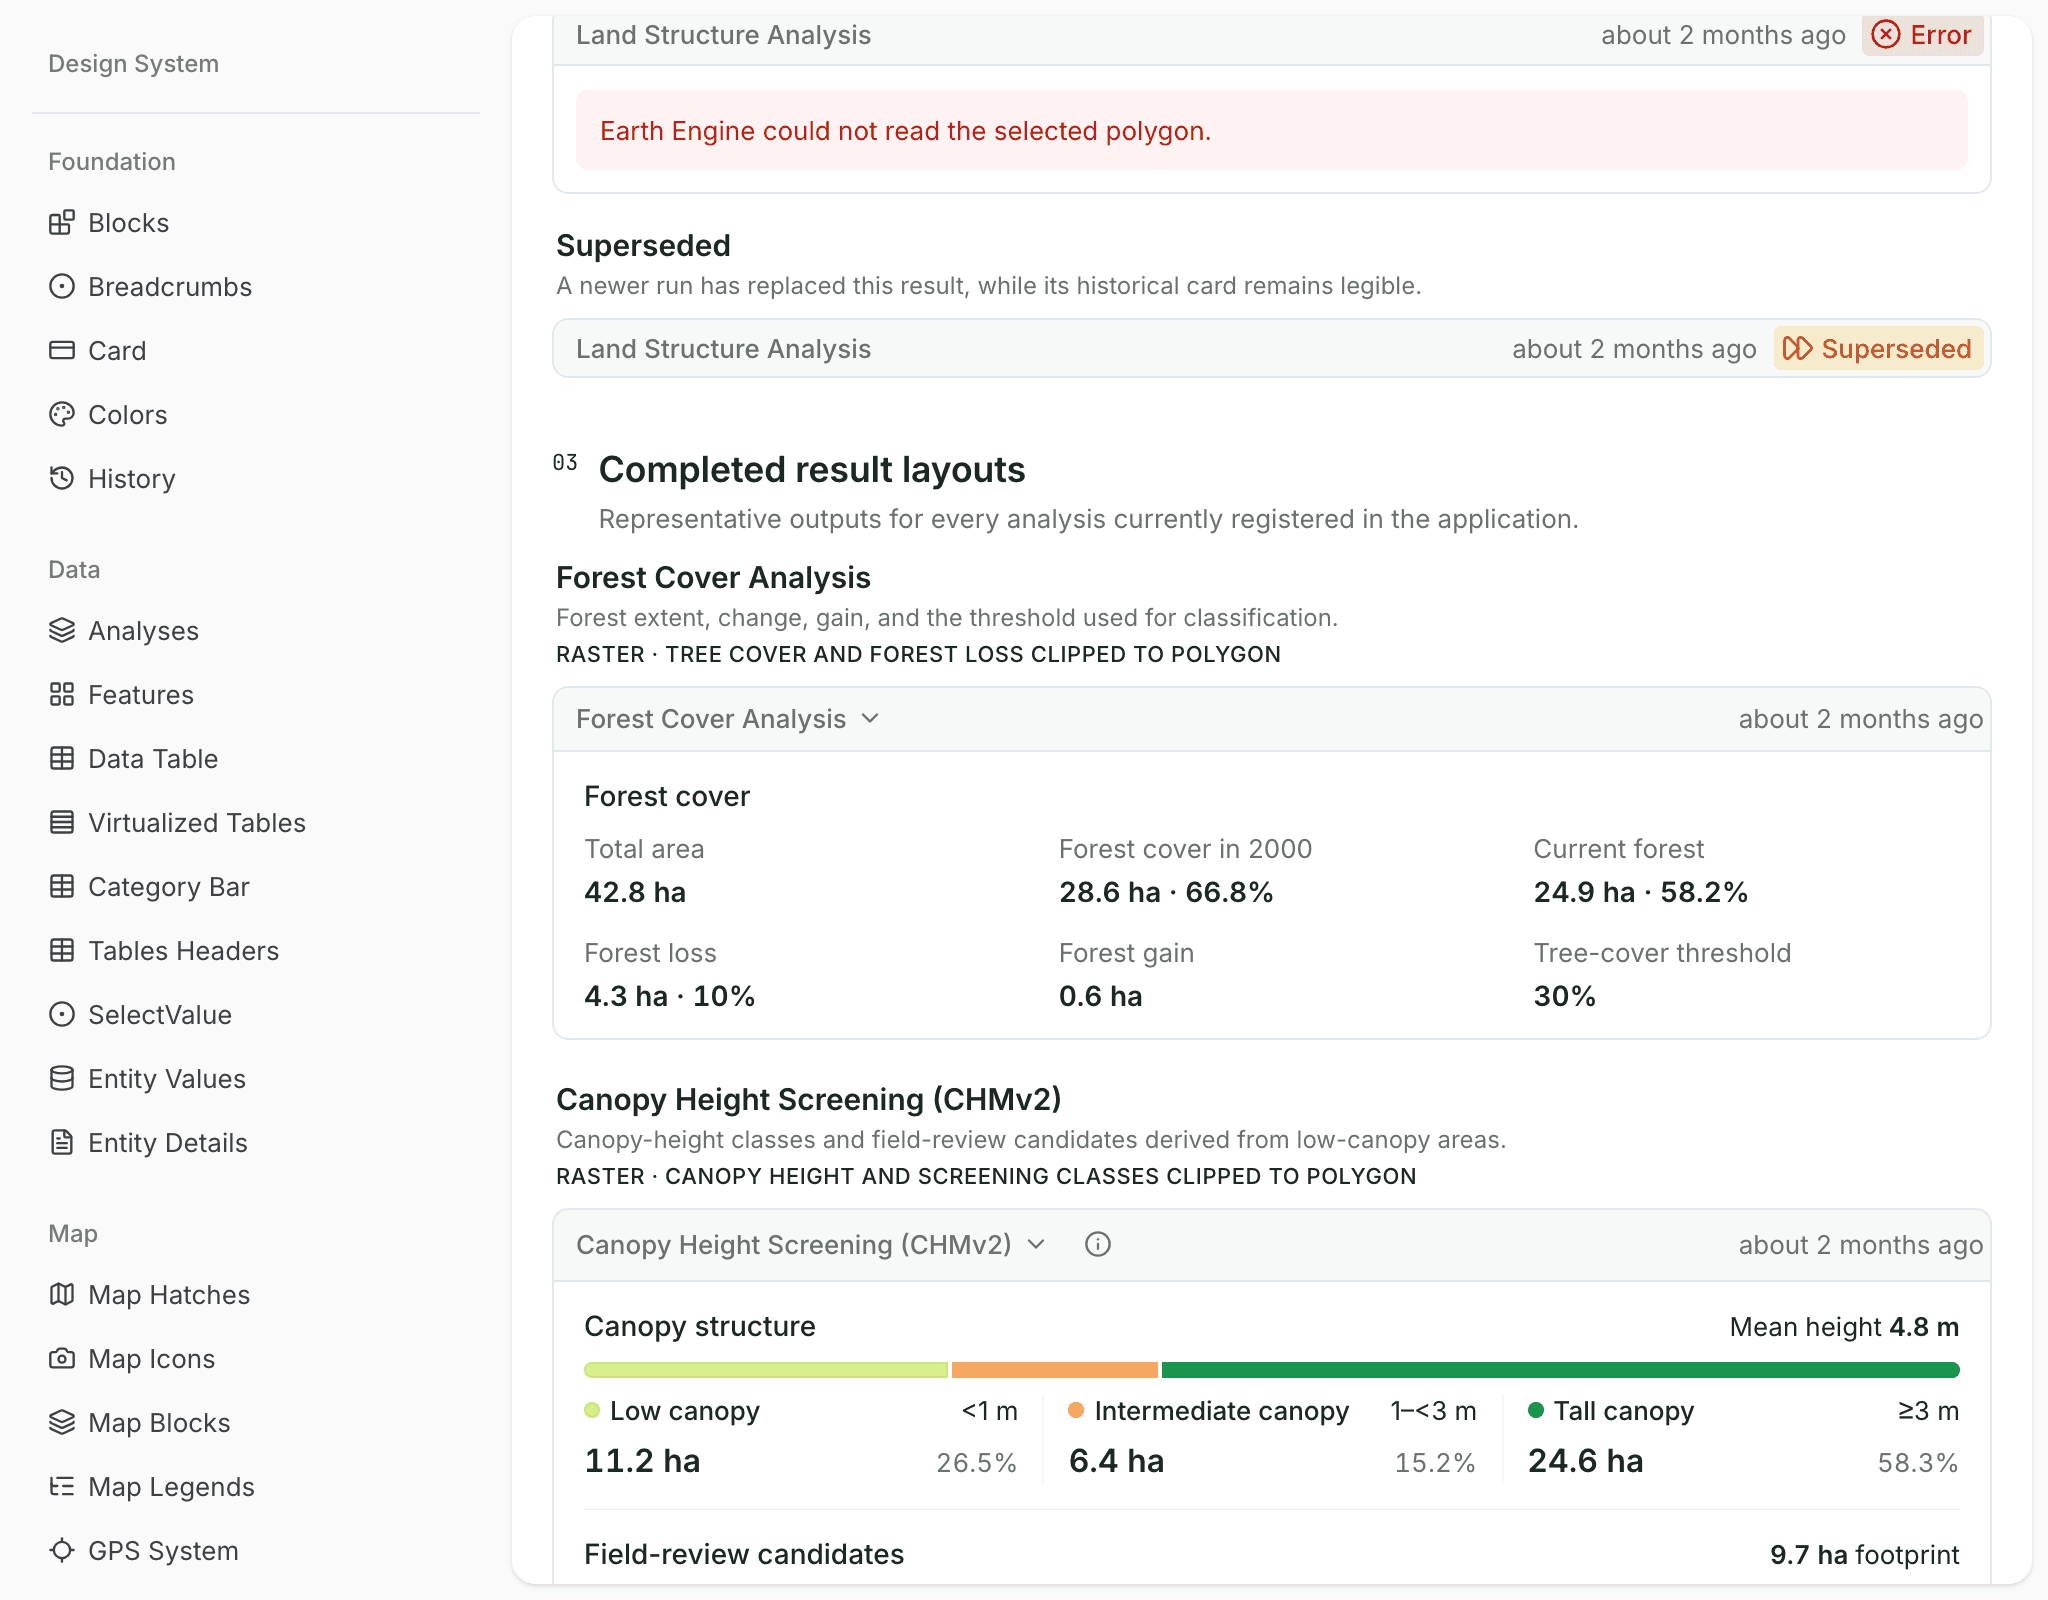
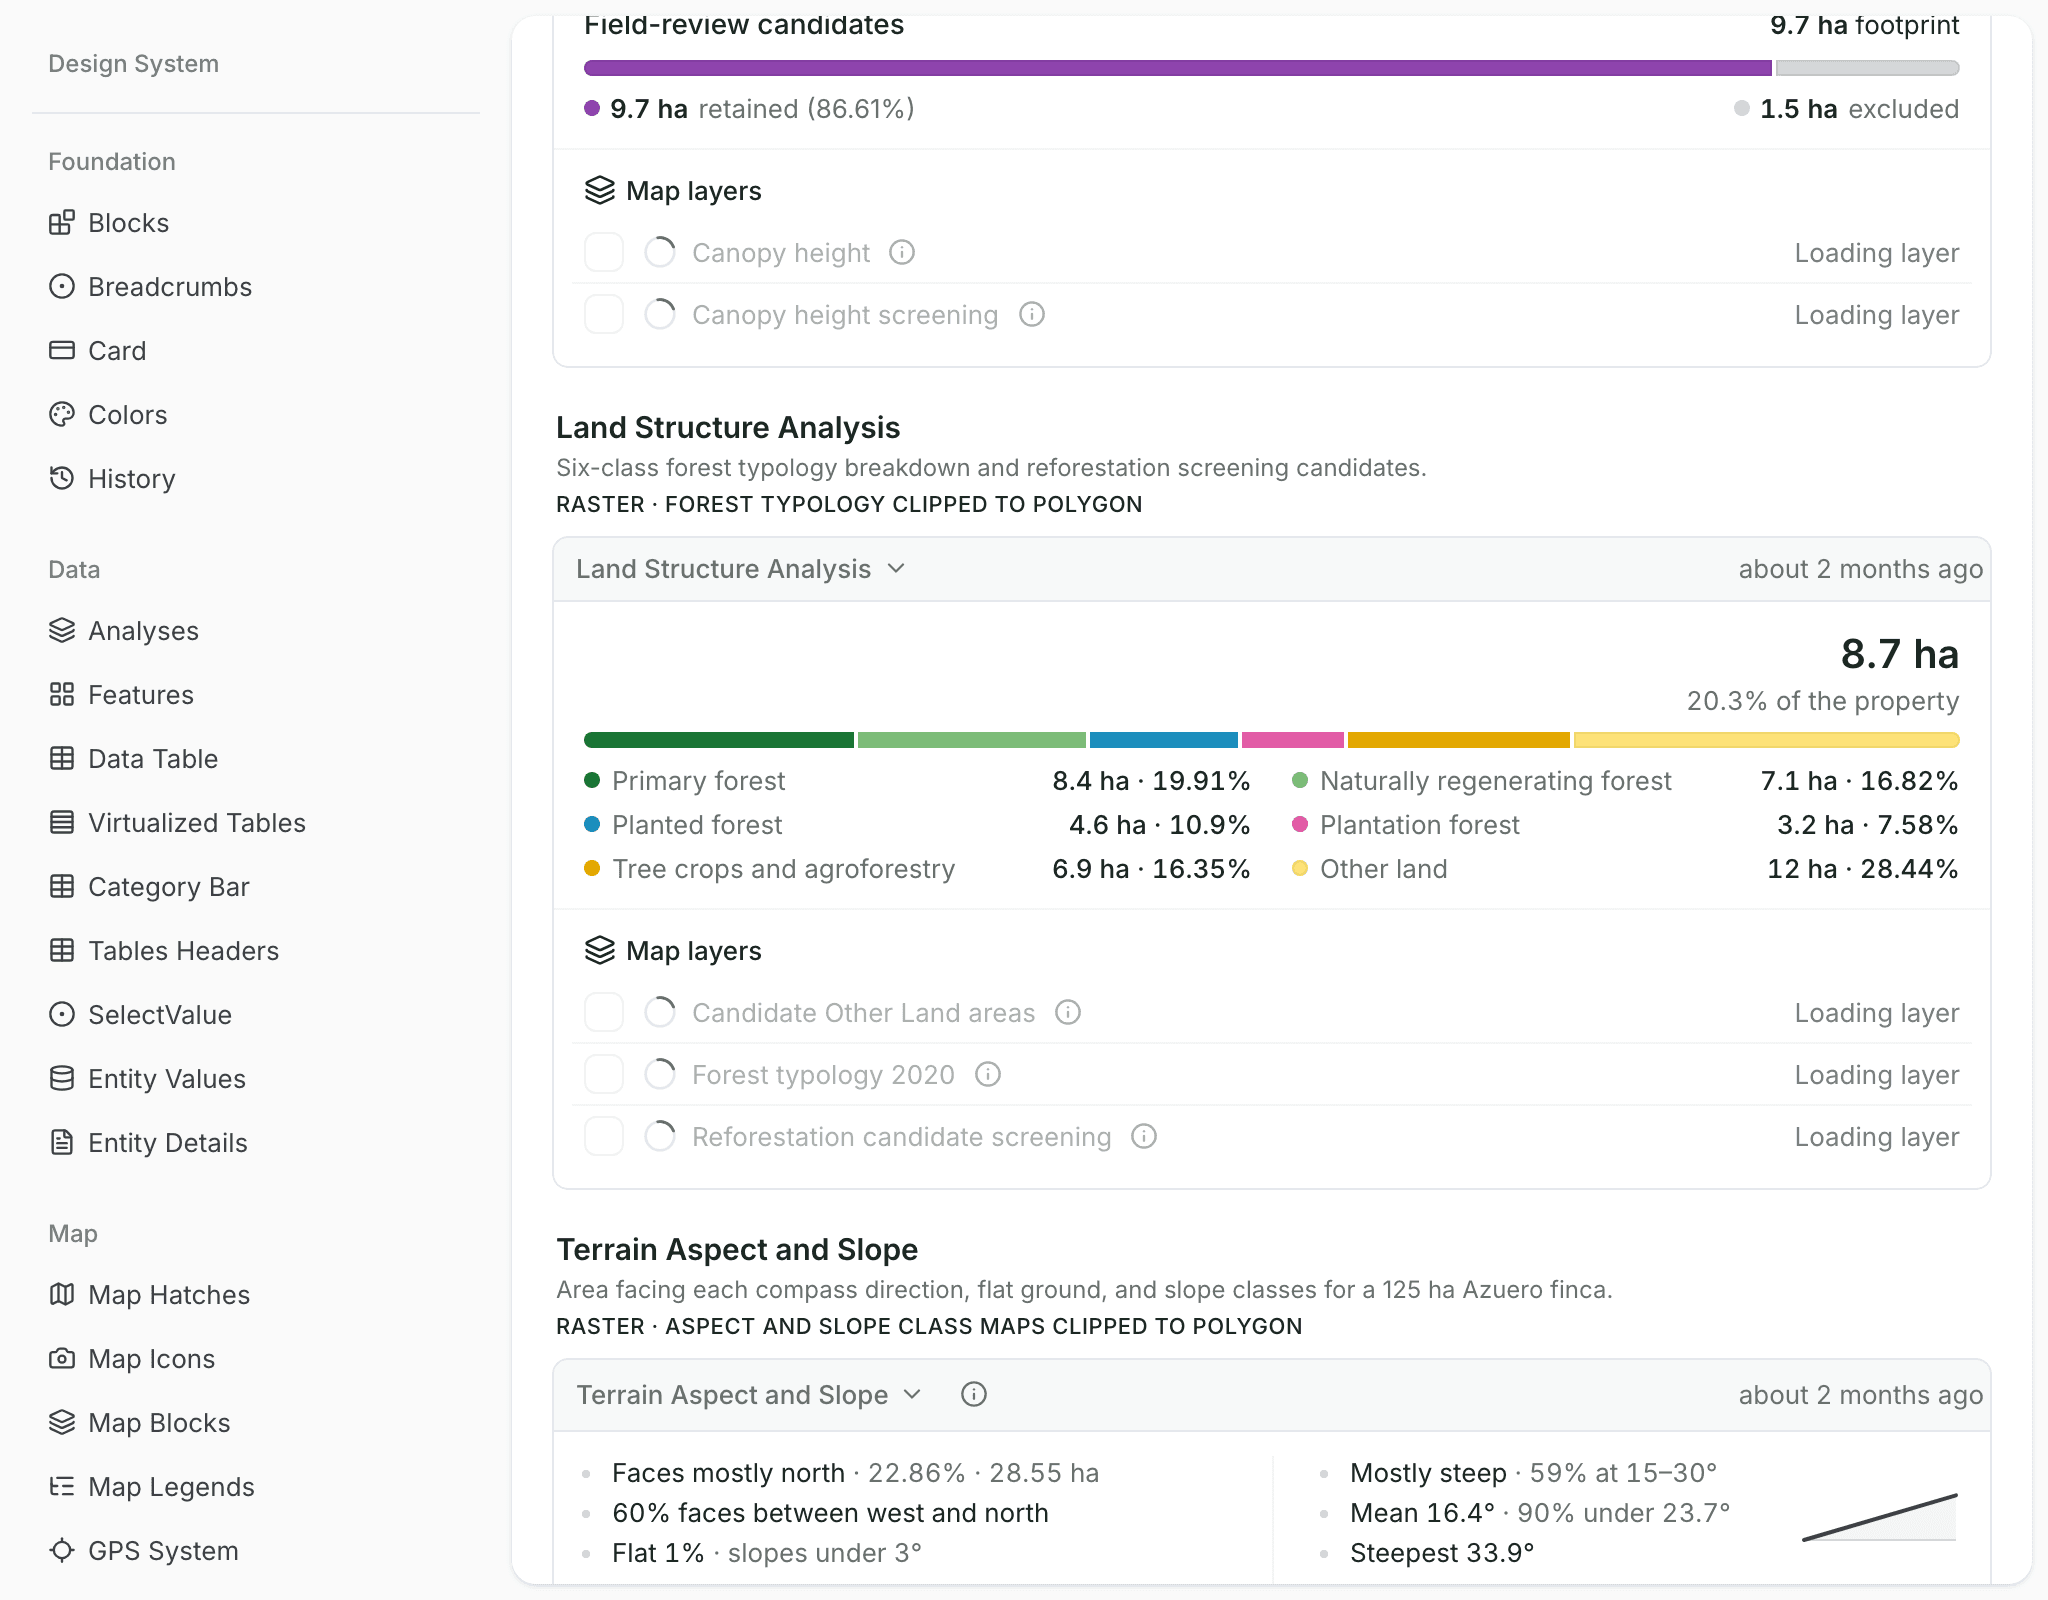
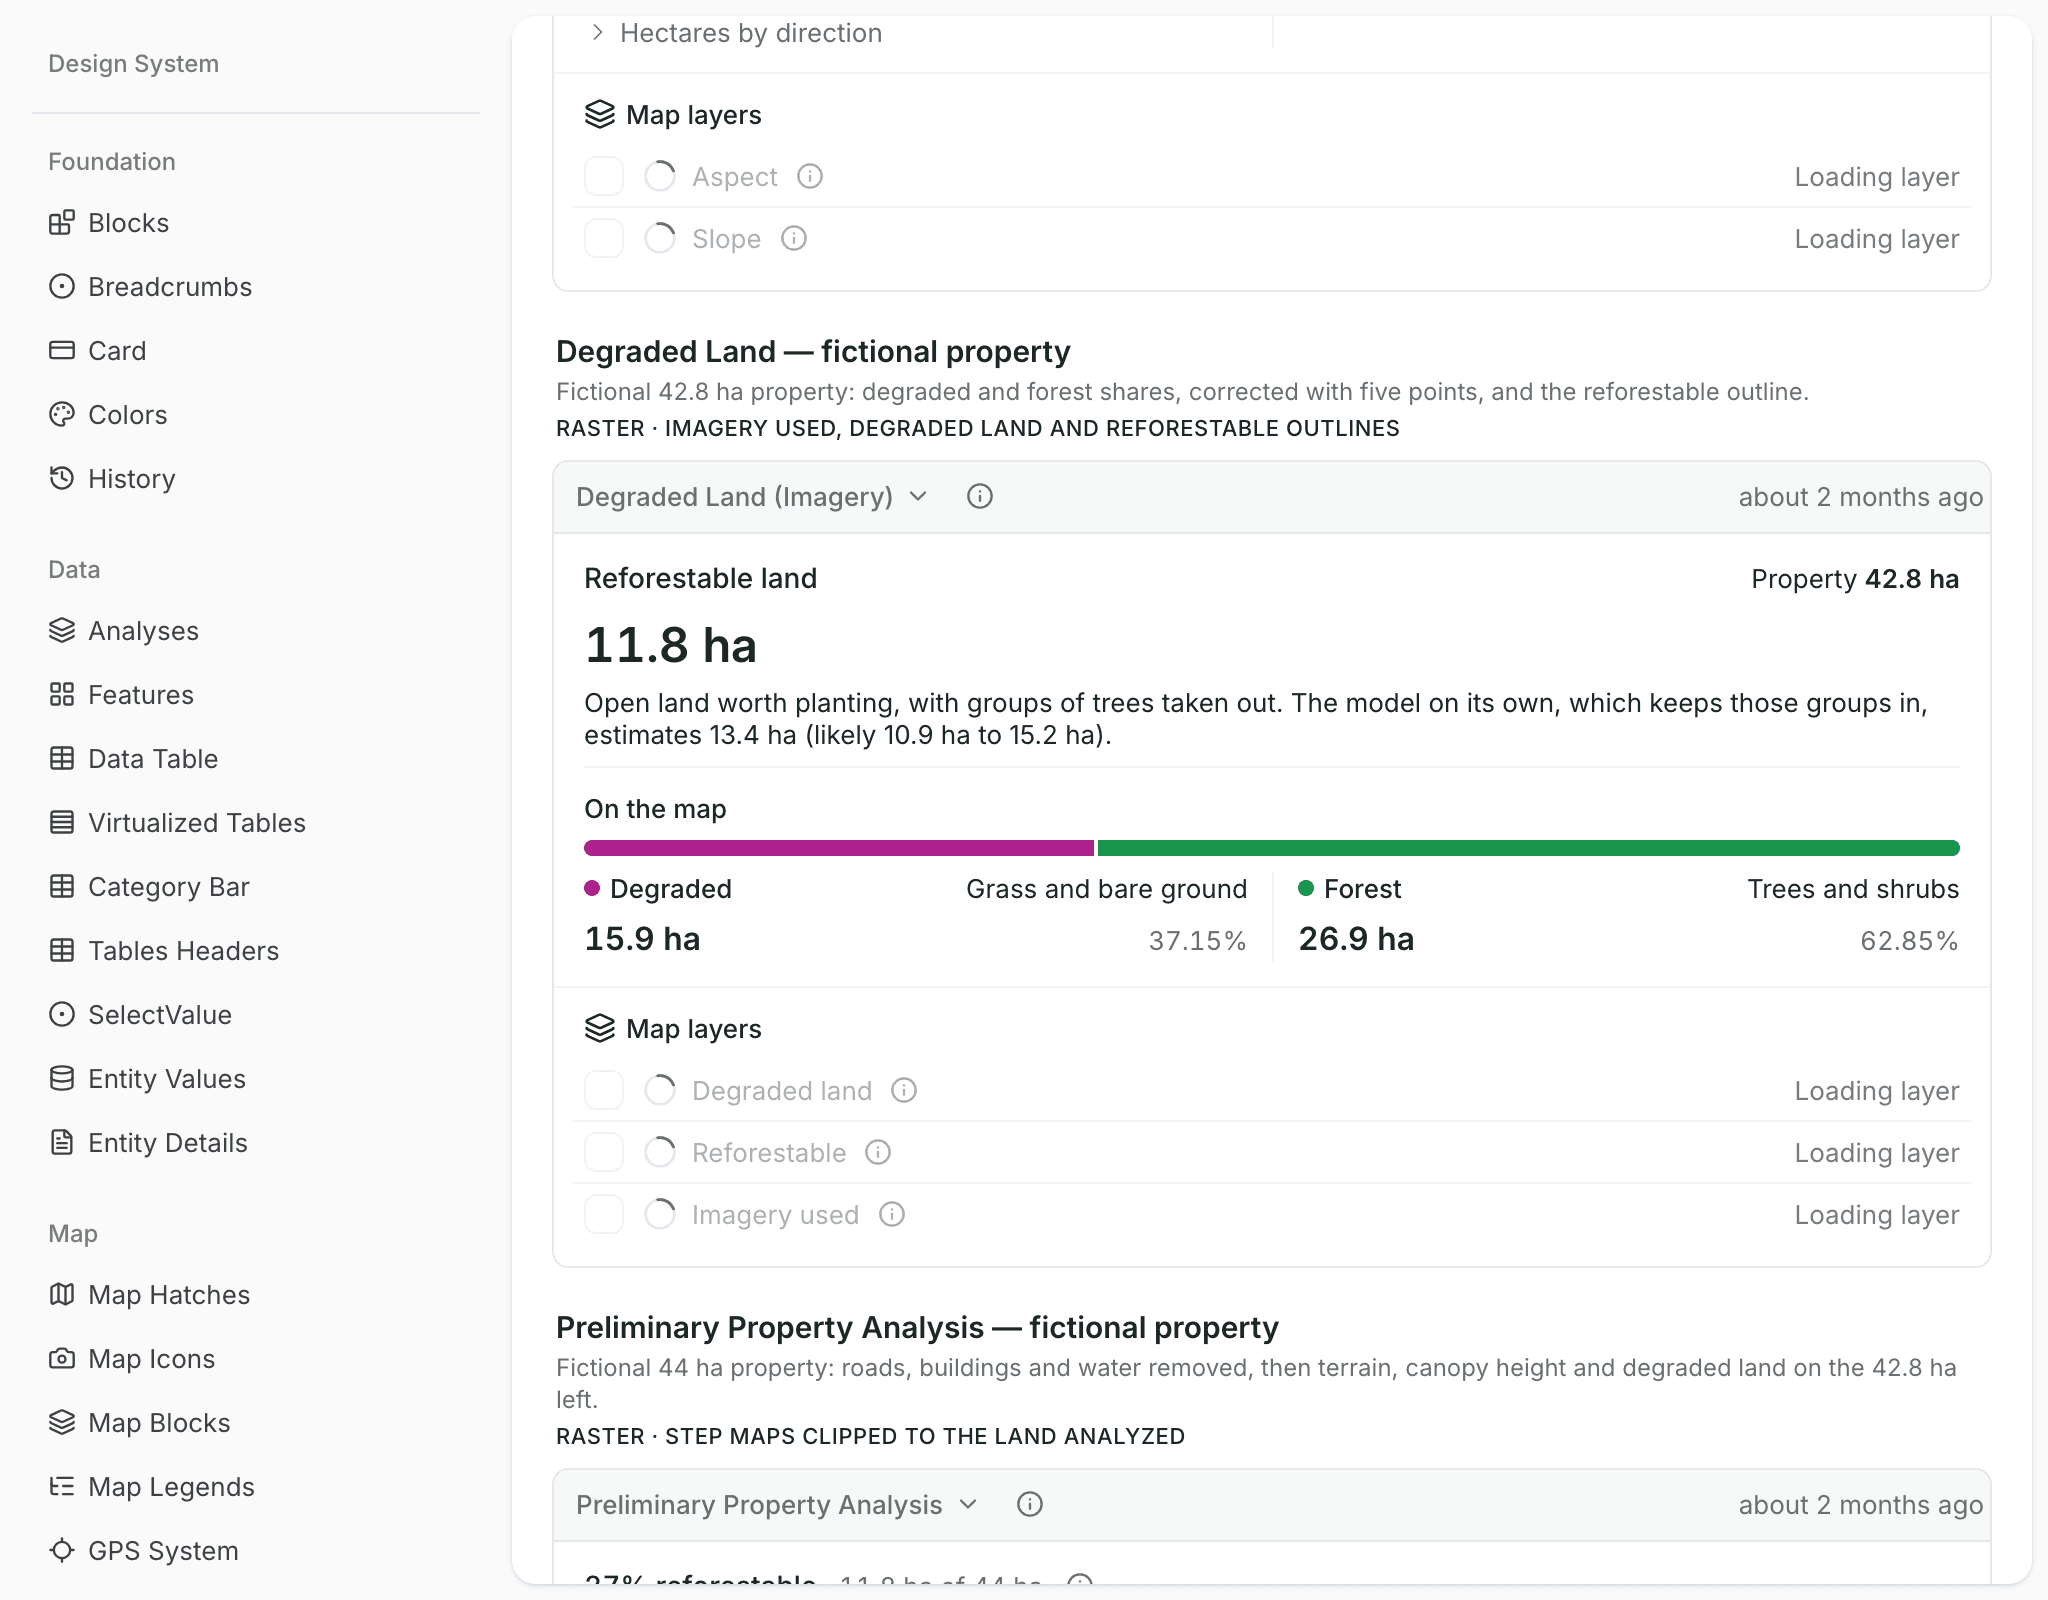
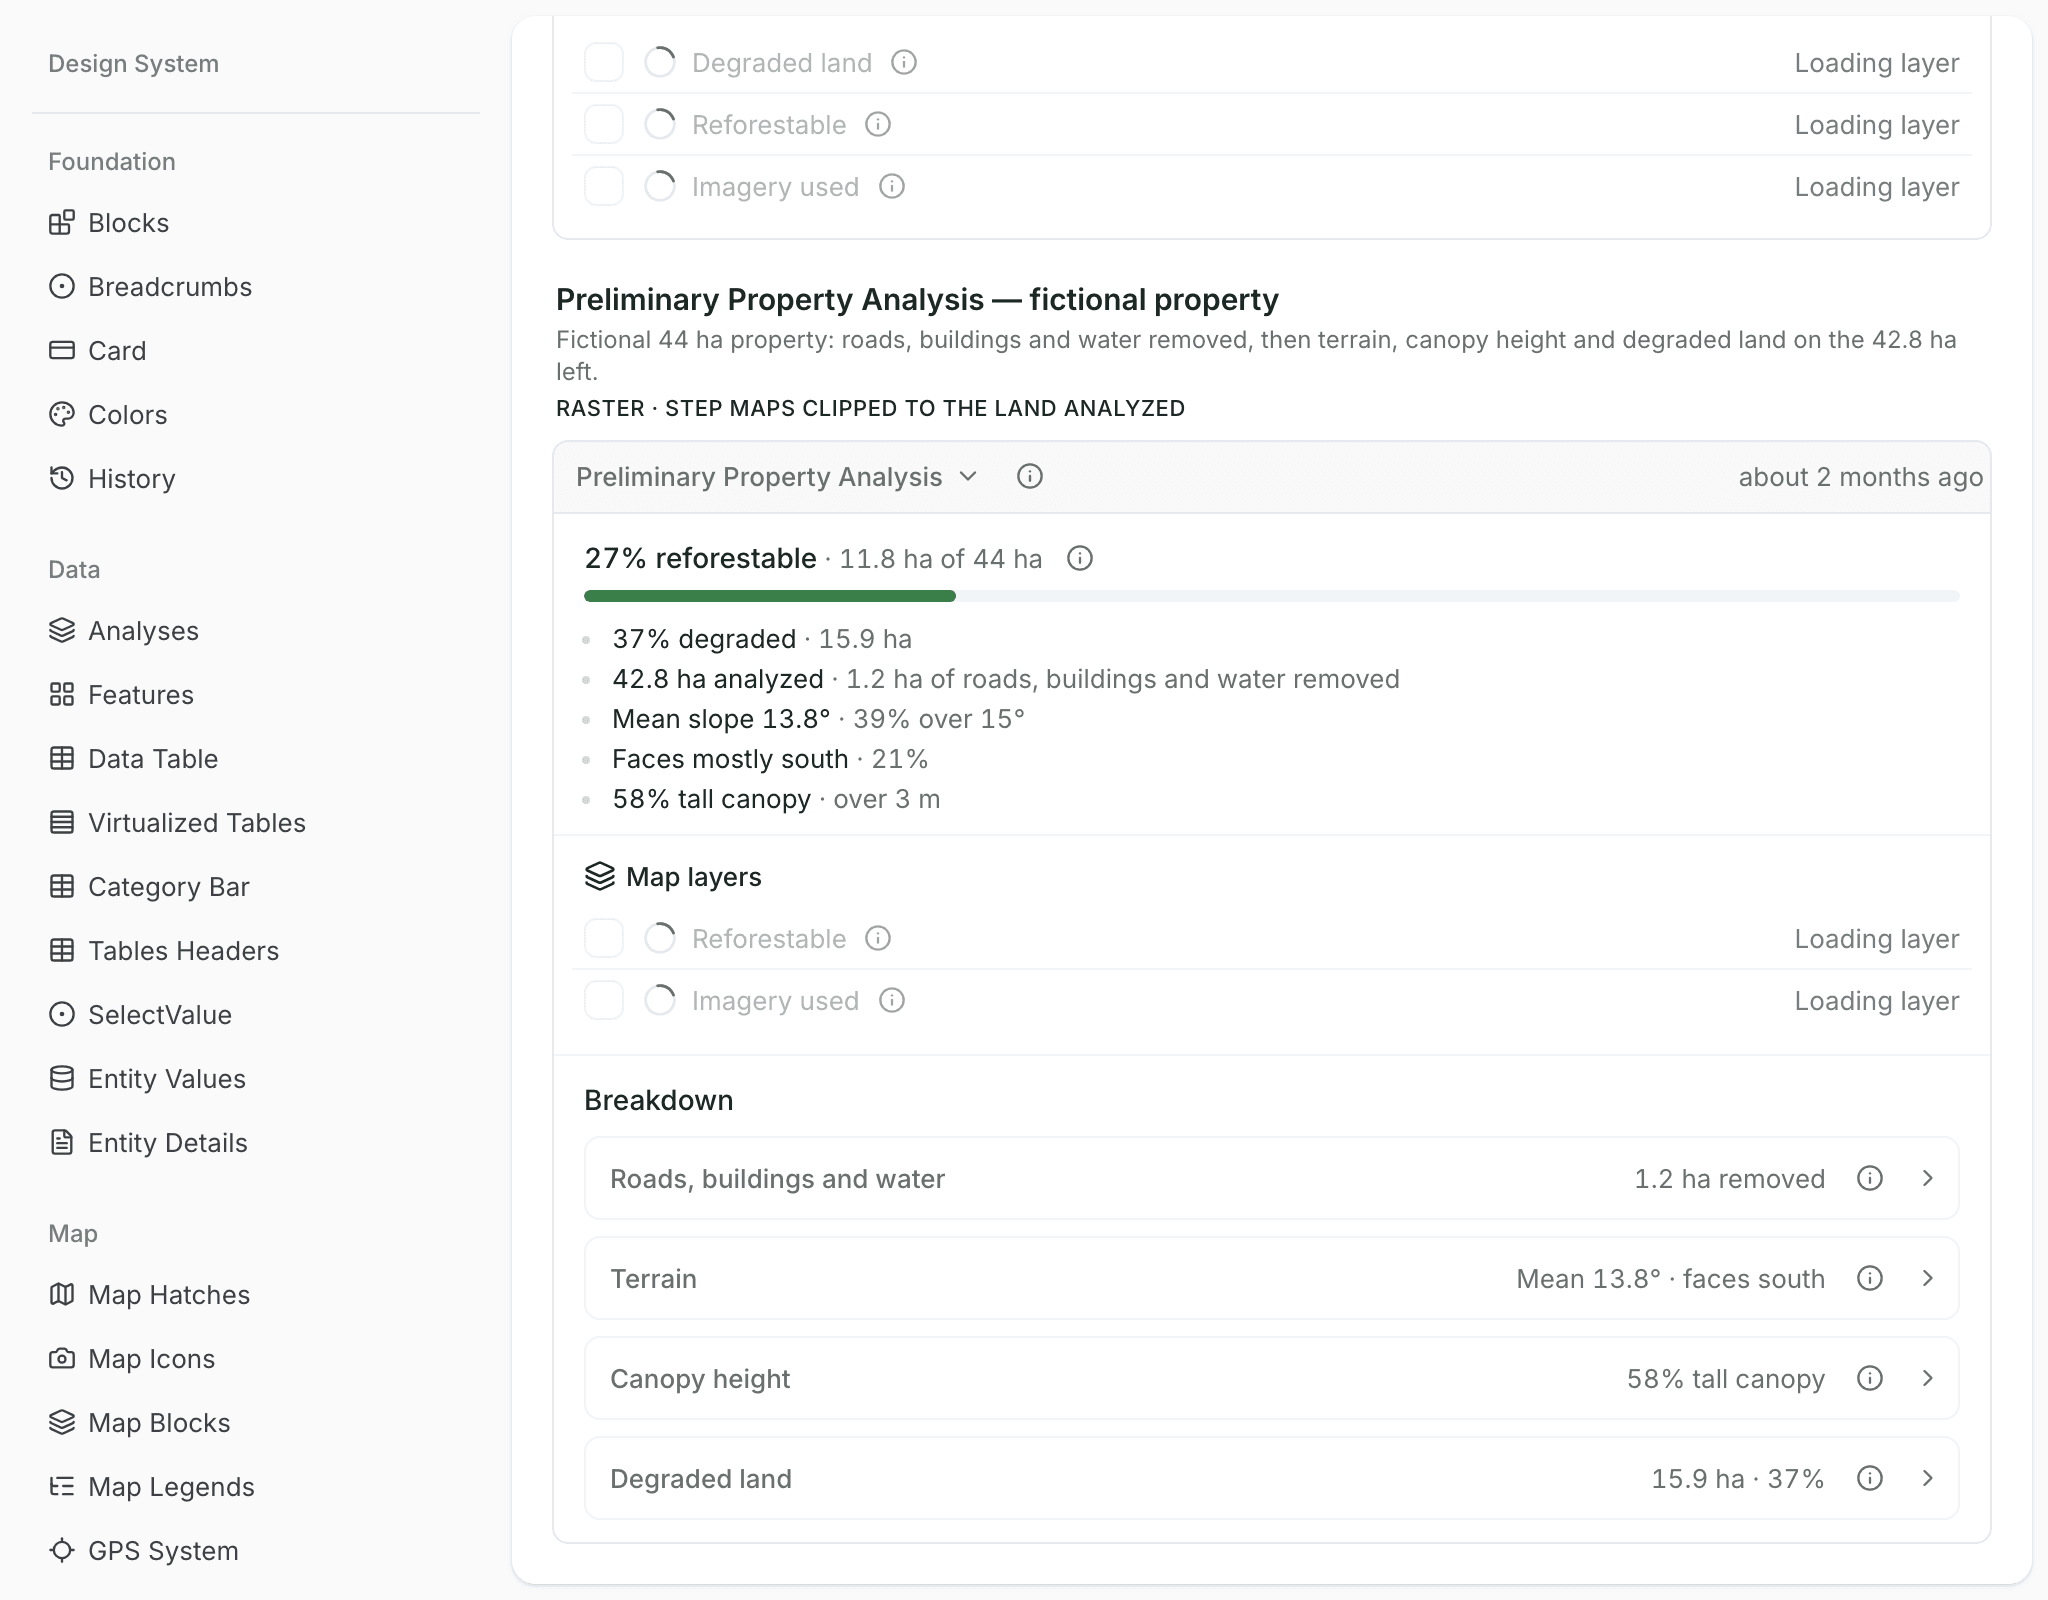
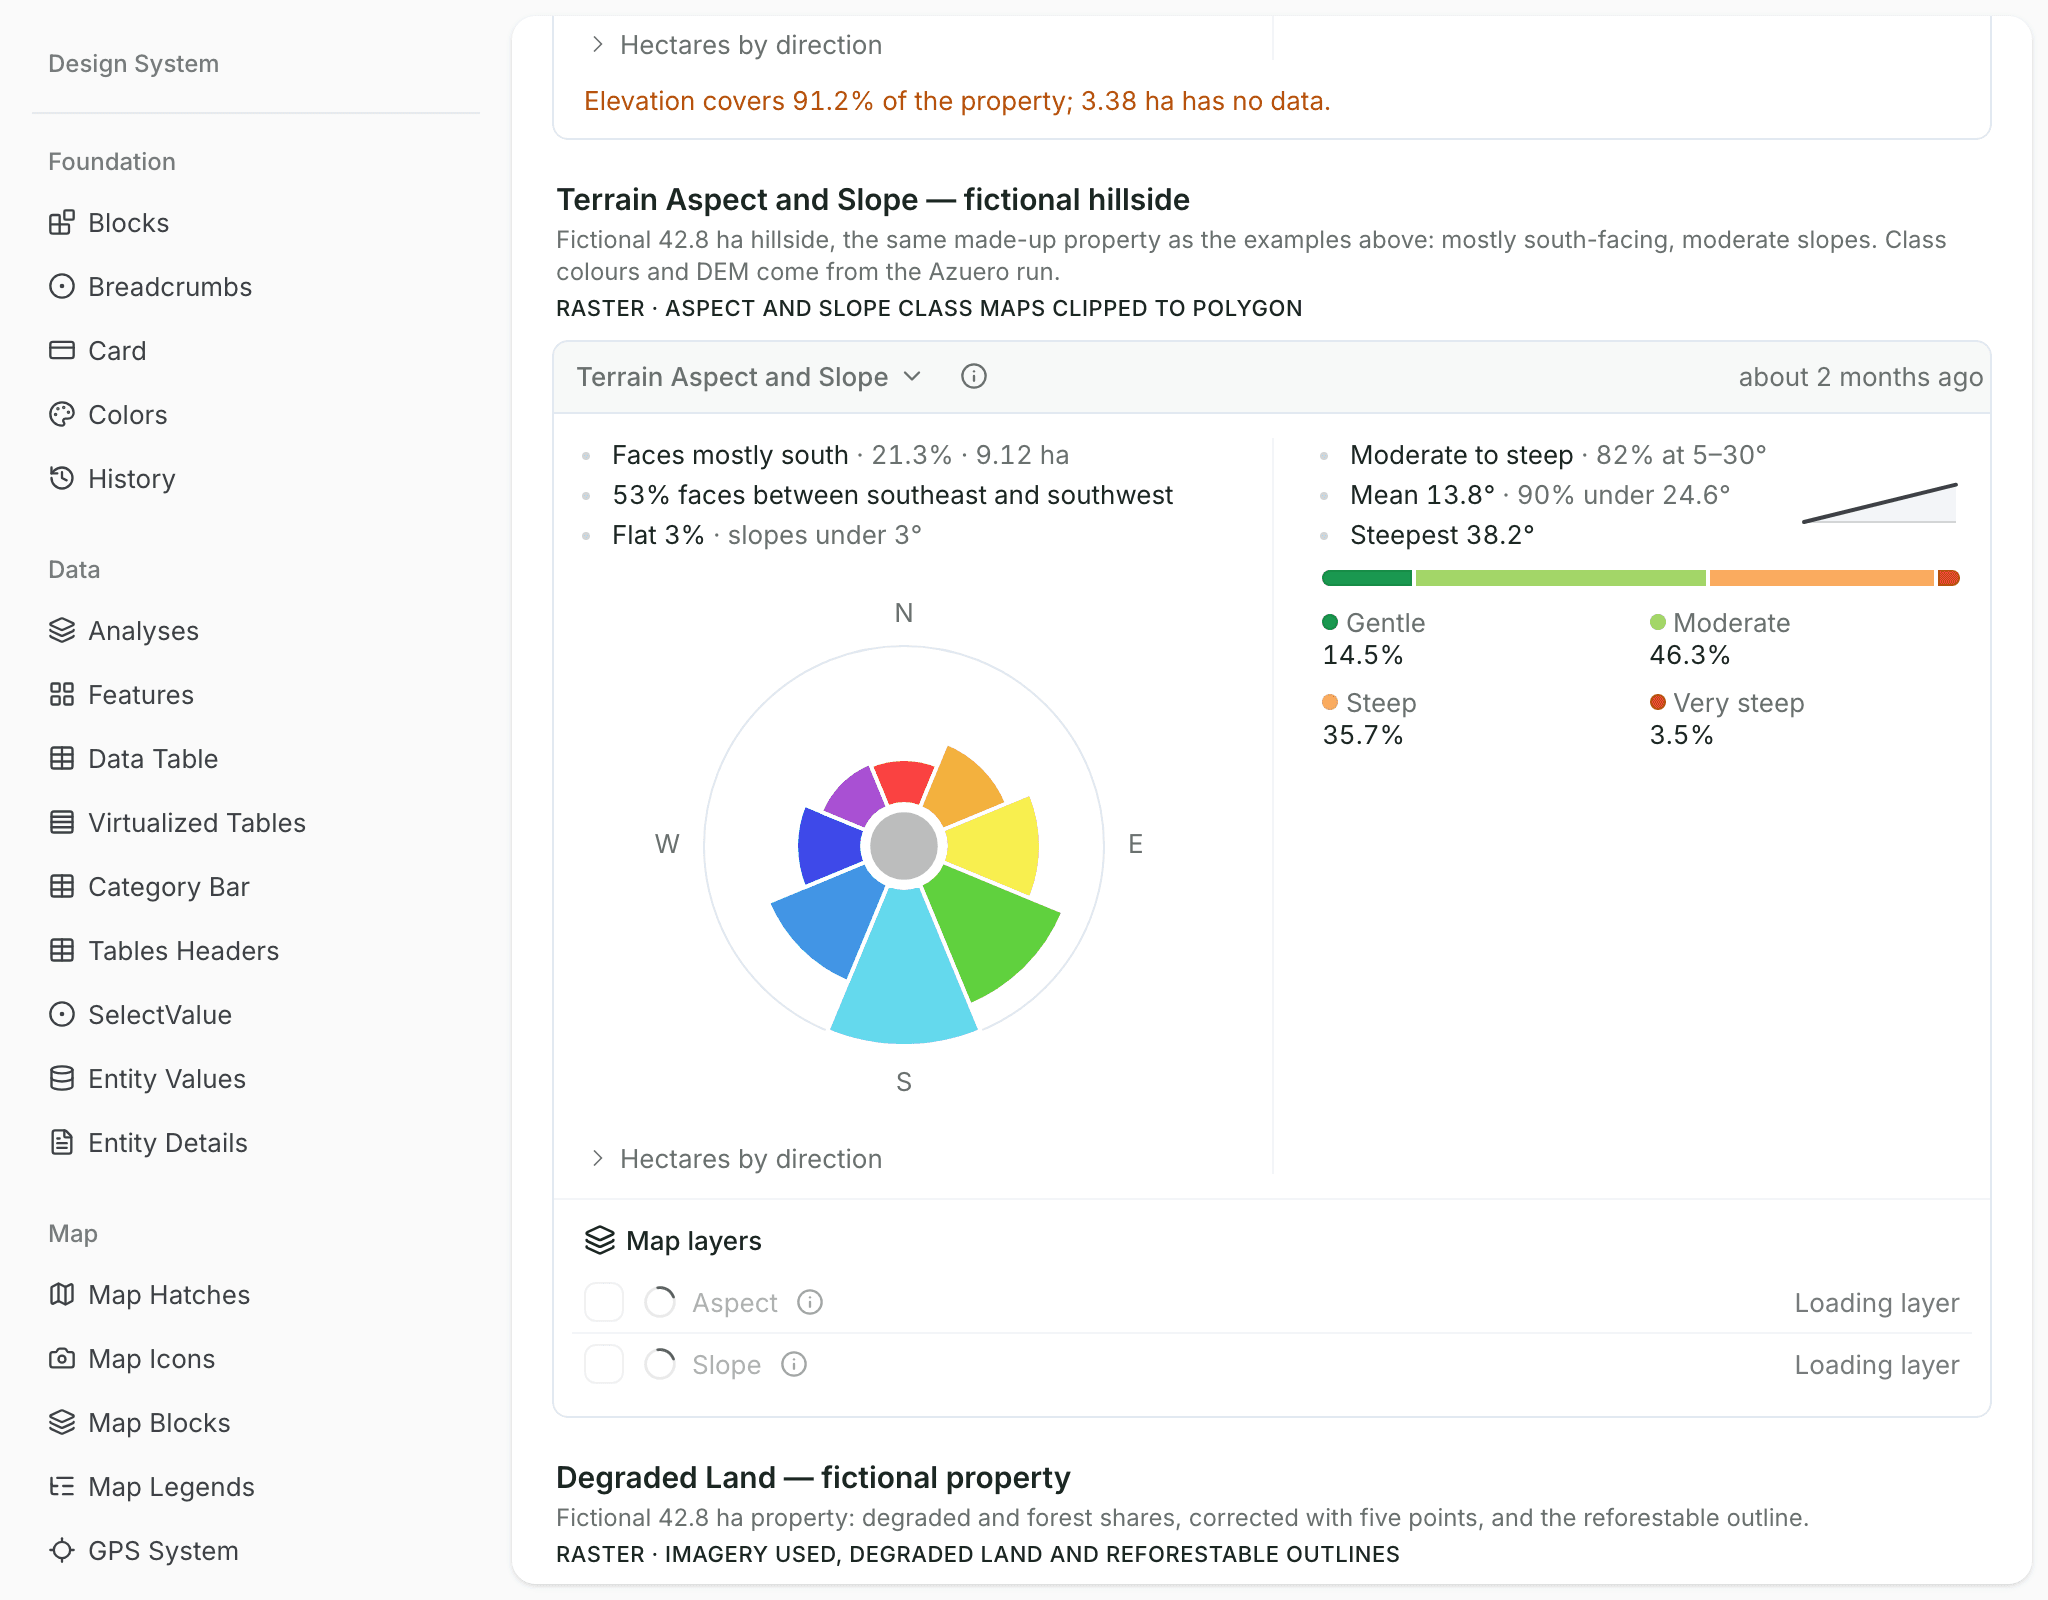
Ready-made analyses for a property boundary: forest history, land types, canopy height, open land, terrain and a one-run property screen. Two are pilots, tested in Panama.

See all analyses
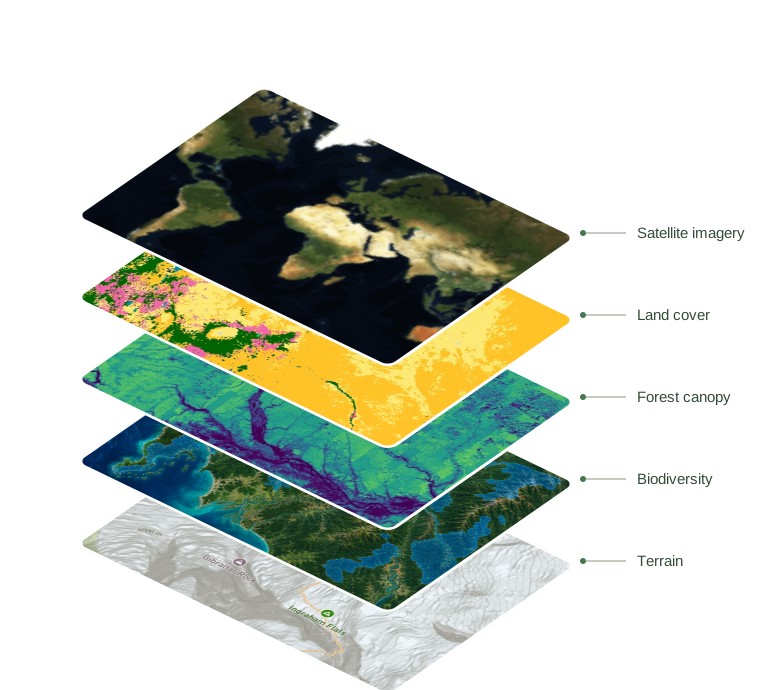
Stacked map layers showing satellite imagery, land cover, forest canopy, terrain and biodiversity

A library of layers to build on.

71 datasets available to process. Bring satellite imagery, land cover, forest, water and terrain data into your team’s workflows.

Explore Data Layers

Common questions

Which analyses can we run today?

Seven ready-made analyses run on a property boundary. Five work anywhere: forest cover, land structure, canopy height, terrain aspect and slope, and EUDR deforestation screening. Two are pilots tested in Panama: degraded land mapping and a preliminary property analysis.

Can it screen land for a carbon project?

Yes. Workflows can screen land eligibility, assess a property or detect change, and prepare inputs for carbon monitoring, across one site or a whole portfolio.

Can you build our own method?

Yes. We prototype your team’s method with you, test it on representative sites, then run it as a repeatable workflow across the project.

What starts a workflow?

A record being created or updated, or a run on demand. Results come back as updated fields and map layers on the records your team uses.

Another question? Email us or book a call.

Connect your data, understand your operations.

Bring in the spreadsheets, field forms and maps you already use, and see every site in one place.